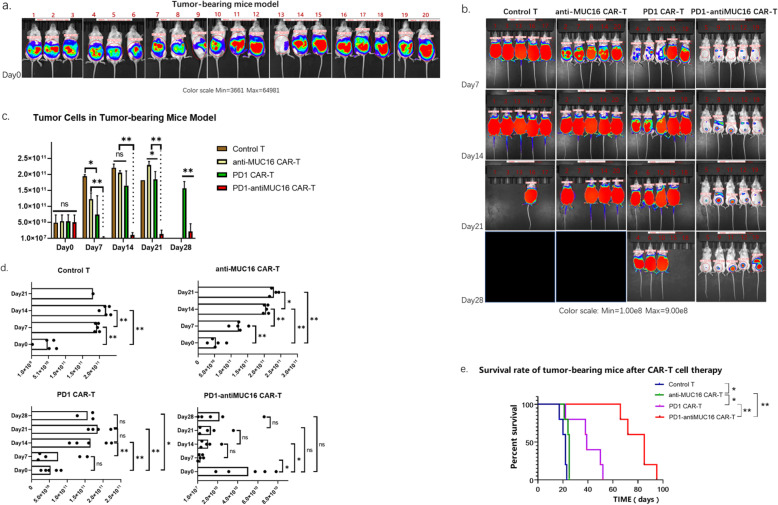
Fig. 7.
Therapeutic efficacy of CAR-T cells on the xenograft mice model. a The Vivo imaging results of OVCAR3-MUC16-GFP-PDL1-luc tumor-bearing mice before treatment. NPG mice were intraperitoneally injected with OVCAR3-MUC16-GFP-PDL1-luc cells (5 × 10⁵) and 50ul Matrigel for 48 h, followed by measuring via IVIS Spectrum and analyzed by Living Image. b The Vivo imaging results of tumor progression in mice at four points (day 7, day 14, day 21and day 28) in time, and were randomized divided into four groups. The black area and empty spaces indicate the mice have died. c The therapeutic effects of the four T cells are compared at the same point in time. d The therapeutic effect of each T cell group is compared at different points in time. e The survival curve of tumor-bearing mice. All groups below the horizontal line have been compared, the two groups pointed by the arrow line are compared. Data show the mean ± SD, and the results were analyzed with Student’t test. Error bars represent the SD. The survival curve was drawn by GraphPad Prism 8.3.0 software. ns: P > 0.05,*: P < 0.05,**: P < 0.01.

