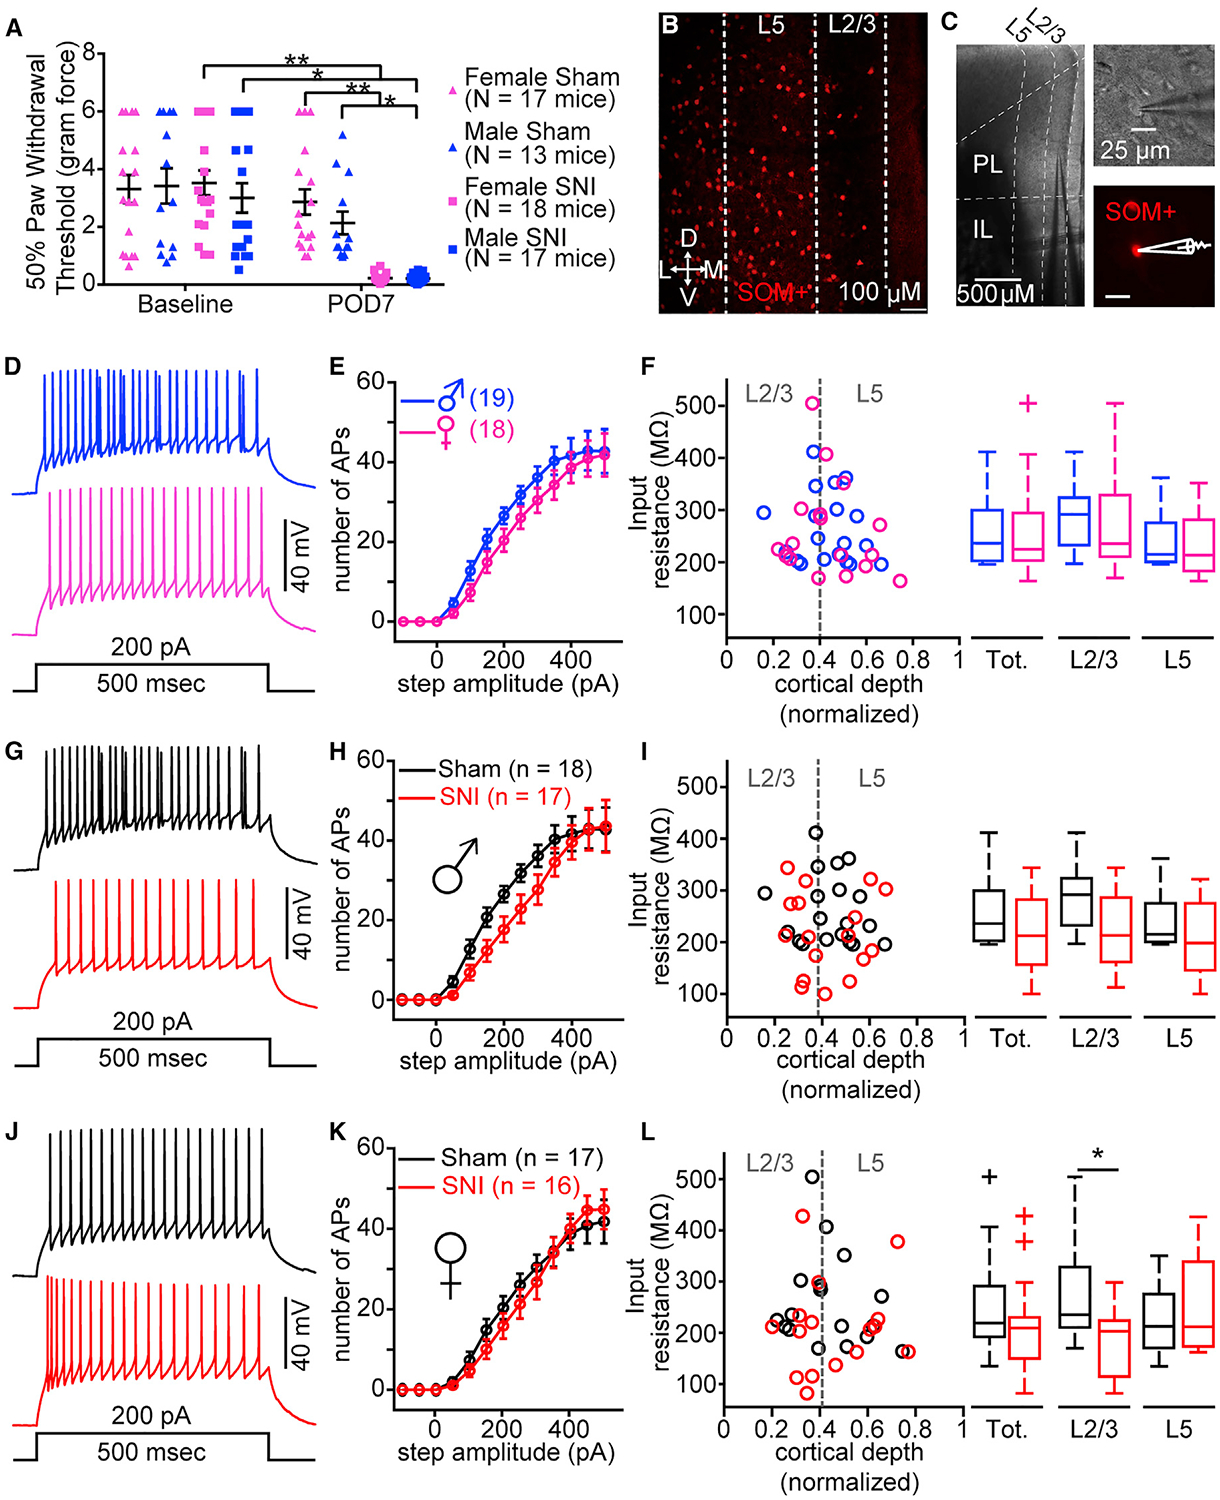
Figure 3. SNI Decreases Excitability of SOM Neurons in PL Cortex.

(A) Mechanical allodynia at baseline and post-operative day 7 (POD7) measured in male and female sham and SNI mice. Two-way repeated-measures ANOVA: interaction, F(1, 63) = 20.39, p < 0.0001; treatment, F(1, 63) = 14.25, p = 0.0004; time, F(1, 63) = 60.29, p < 0.0001. Sidak post hoc tests revealed no significant differences between males and females at baseline and POD7. *p < 0.05; **p < 0.0001.
(B) Example fluorescent confocal 10× image of a brain slice displaying distribution of SOM-tdTomato (SOM) neurons in the PL cortex.
(C) Representative images of a SOM neuron recording in PL cortex at 4× (left) and 60× (right).
(D and E) Example traces of action potential (AP) firing (D) and mean (±SEM) number of APs elicited in response to increasing step current from sham male and female mice (E) (two-way ANOVA: interaction, F(12, 420) = 0.52, p = 0.90; sex, F(1, 35) = 1.76, p = 0.19; current, F(12, 420) = 92.62, p < 0.0001).
(F) Raw data and boxplots representation for input resistance versus normalized soma location for total (Mann-Whitney U = 144, n1 = 19, n2 = 17, p = 0.59), L2/3 (t(15) = 0.11, p = 0.91), and L5 t(15) = 0.62, p = 0.54) SOM neurons from sham females (total, n = 17 neurons; 8 mice) and males (total, n = 18 neurons; 7 mice).
(G and H) Example traces of AP firing (G) and mean (±SEM) number of APs elicited from male sham and SNI mice (H) (two-way ANOVA: interaction, F(12, 408) = 1.03, p = 0.42; injury, F(1, 34) = 2.46, p = 0.13; current injection, F(12, 408) = 78.76, p < 0.0001).
(I) Input resistance versus normalized soma location for total (t(34) = 1.83, p = 0.08), L2/3 (t(15) = 1.64, p = 0.12), and L5 (Mann-Whitney U = 31, n1 = 8, n2 = 9, p = 0.67) SOM neurons from male sham (total, n = 20 neurons; 7 mice) and SNI (total, n = 18 neurons; 8 mice).
(J and K) Example traces of AP firing (J) and mean (±SEM) number of APs elicited from female sham and SNI mice (K) (two-way ANOVA: interaction, F(12, 384) = 0.67, p = 0.78; injury, F(1, 32) = 0.16, p = 0.69; current, F(12, 384) = 95.05, p < 0.0001).
(L) Input resistance versus normalized soma location for total (Mann-Whitney U = 90, n1 = 16, n2 = 17, p = 0.10), L2/3 (t(16) = 2.39, p = 0.03), and L5 (Mann-Whitney U = 27, n1 = 7, n2 = 8, p = 0.96) SOM neurons from female sham (total, n = 17 neurons; 8 mice) and SNI (total, n = 16 neurons; 7 mice). Plus symbol indicates outlier in MATLAB. *p < 0.05.
Data represent mean ± SEM.
