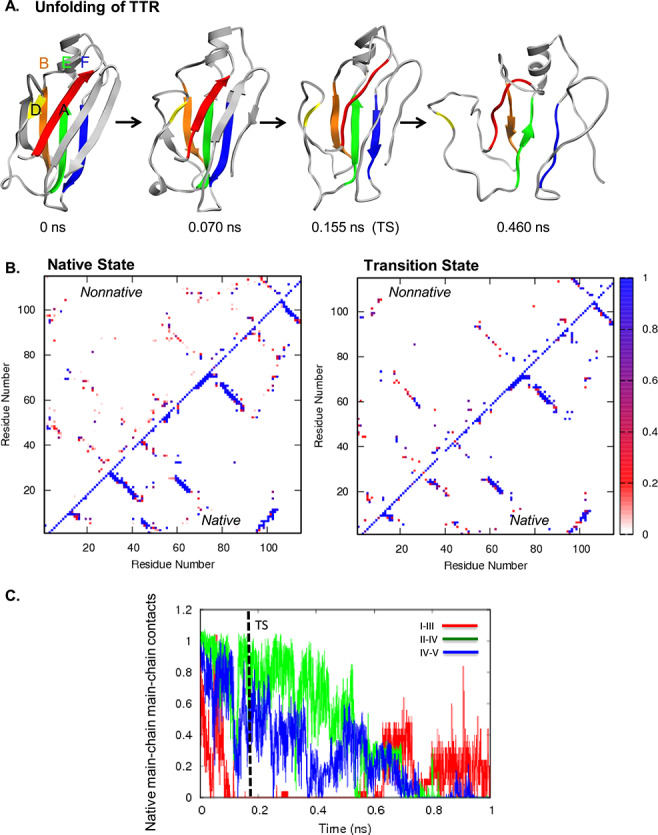
Fig. 3. (A) Unfolding pathway of TTR. Strands colored as follows: I in red, II in orange, III in yellow, IV in green, and V in blue. (B) Contact maps show the fraction of time residues were in contact with non-native contacts (above the diagonal) or with native contacts (below). Contacts are colored from white through red and purple to blue, where white indicates that the residues were never in contact and blue those that were in contact 100% of the time. (C) Native mainchain–mainchain atom contacts between strands I and III (red), strands II and IV (green), and strands IV and V (blue). Results are provided for Simulation 1.

