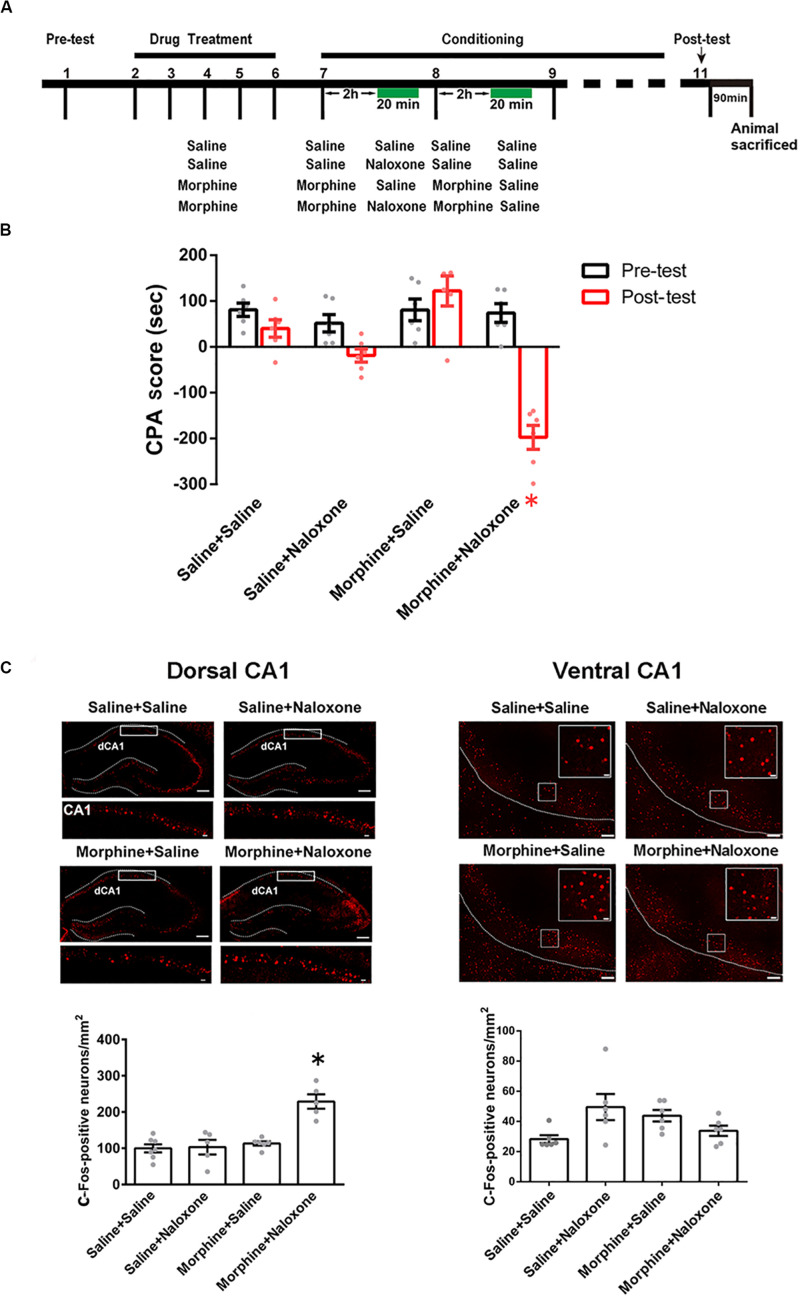
FIGURE 1.
The influence of conditioned context on c-Fos expression in the CA1 of dorsal and ventral hippocampus in morphine withdrawn mice. (A) The experimental timeline and groups for the CPA procedure. (B) The CPA score of each group (n = 6 in each group, *p = 0.0037, compared with pre-test, two-way ANOVA, Bonferroni post hoc analysis). (C) Left top panel: C-Fos positive neurons (red-colored) of the CA1 of dorsal hippocampus in each group. Scale bar = 100 μm. Higher magnification images of boxed regions are shown on the bottom. Scale bar = 20 μm. Left down panel: average number of c-Fos positive neurons in the CA1 of dorsal hippocampus of each group (n = 6 in saline + saline group and morphine + saline group, n = 5 in saline + naloxone group and morphine + naloxone group, *p < 0.0001, one-way ANOVA following by Tukey post hoc analysis). Right top panel: C-Fos positive neurons (red-colored) of the CA1 of ventral hippocampus in each group. Scale bar = 100 μm. Higher magnification images of boxed regions are shown on the right. Scale bar = 20 μm. Right down panel: average number of c-Fos positive neurons of the CA1 of ventral hippocampus of different groups (n = 6 in each group). Data are shown as the mean ± SEM.

