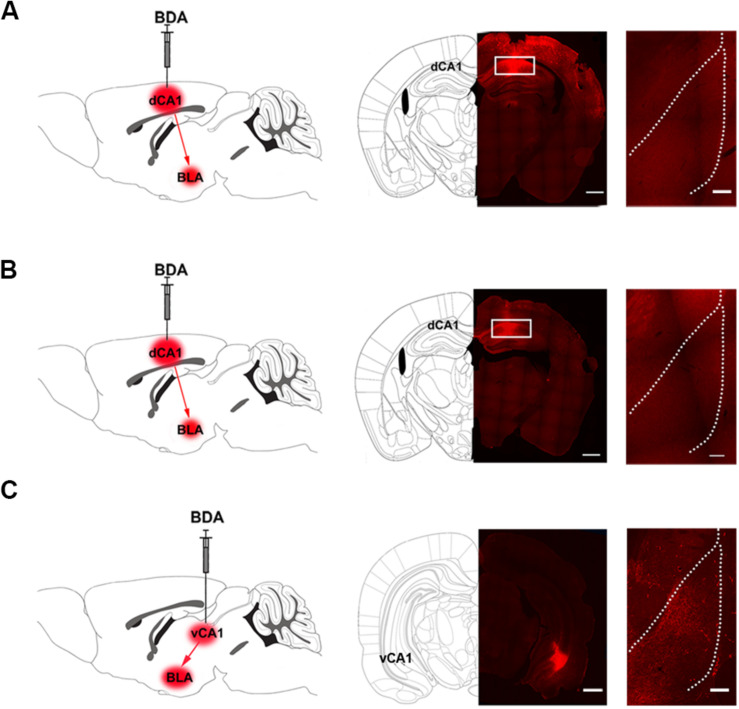
FIGURE 3.
The projection from the CA1 of dorsal and ventral hippocampus to the BLA in mice. (A) Left panel: diagram of the injection site of BDA in the CA1 of dorsal hippocampus. Middle panel: the typical injection site of BDA (red-colored) in the dorsal CA1 of the hippocampus in mice of control group. Bar = 500 μm. Right panel: the BDA-positive fibers (red-colored) in the BLA from the CA1 of dorsal hippocampus on seventh day after BDA injection. Bar = 100 μm. (B) Left panel: diagram of the injection site of BDA in the CA1 of dorsal hippocampus. Middle panel: the typical injection site of BDA (red-colored) in the CA1 of dorsal hippocampus in mice with conditioned place aversion. Bar = 500 μm. Right panel: the BDA-positive fibers (red-colored) in the BLA from the CA1 of dorsal hippocampus on seventh day after BDA injection. Bar = 100 μm. (C) Left panel: diagram of the injection site of BDA in the CA1 of ventral hippocampus. Middle panel: the typical injection site of BDA (red-colored) in the CA1 of ventral hippocampus in mice of control group. Bar = 500 μm. Right panel: the BDA-positive fibers (red-colored) in the BLA from the CA1 of ventral hippocampus on seventh day after BDA injection. Bar = 100 μm.

