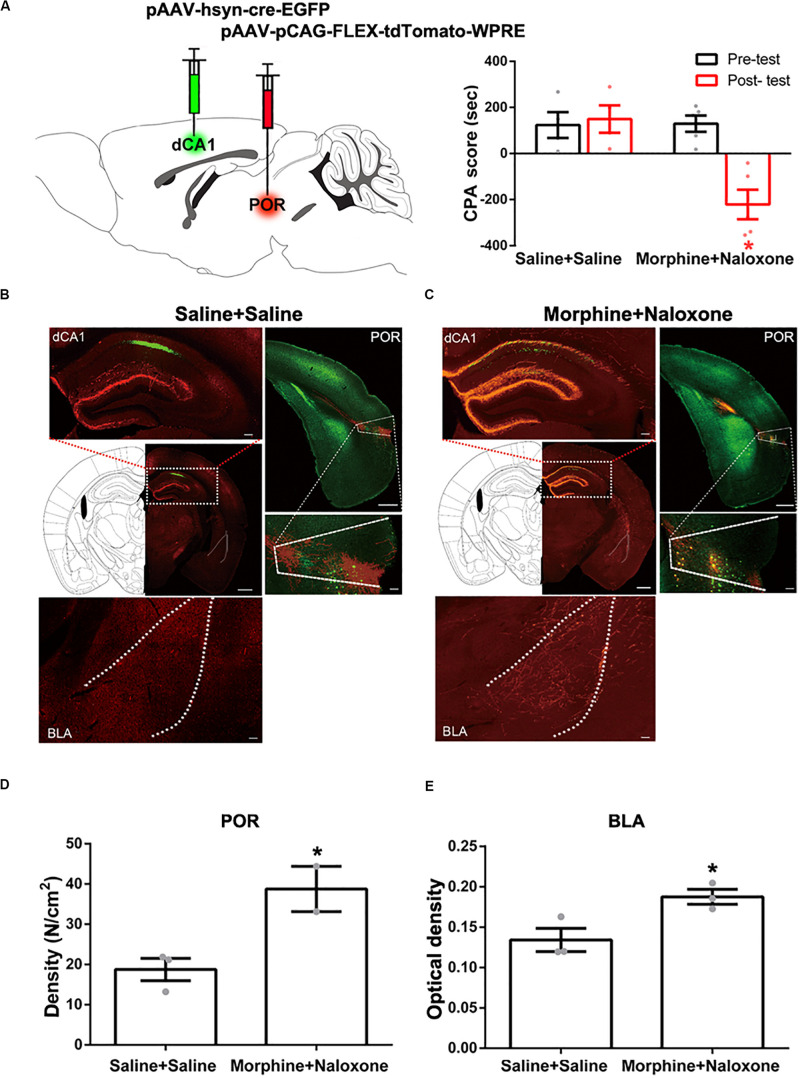
FIGURE 5.
Neural circuit mediated by the POR from the CA1 of dorsal hippocampus to the BLA in saline-treated mice and mice with conditioned place aversion. (A) Left panel: diagram of the injection sites of viruses in the CA1 of dorsal hippocampus and the POR. Right panel: the CPA scores of saline + saline group and morphine + naloxone group (n = 4 in saline + saline group, n = 5 in morphine + naloxone group, *p = 0.004, compared with pre-test, two-way ANOVA, Bonferroni post hoc analysis). (B) Left top panel: the expression of Cre-EGFP (green-colored) in the CA1 of dorsal hippocampus after post-test in saline + saline group. Scale bar = 500 μm. The magnified image of the CA1 of dorsal hippocampus is shown on the top. Scale bar = 100 μm. Right top panel: Cre positive neurons (green-colored) and the expression of tdTomato-WPRE (red-colored) in the POR after post-test in saline + saline group. Scale bar = 500 μm. The magnified image of the POR is shown on the bottom. Scale bar = 100 μm. Down panel: the tdTomato positive fibers (red-colored) in the BLA in saline + saline group. Scale bar = 100 μm. (C) Left top panel: the expression of Cre-EGFP (green-colored) in the CA1 of dorsal hippocampus after post-test in morphine + naloxone group. Scale bar = 500 μm. The magnified image of the CA1 of dorsal hippocampus is shown on the top. Scale bar = 100 μm. Right top panel: Cre positive neurons (green-colored) and the expression of tdTomato-WPRE (red-colored) in the POR after post-test in morphine + naloxone group. Scale bar = 500 μm. The magnified image of the POR is shown on the bottom. Scale bar = 100 μm. Down panel: the tdTomato positive fibers (red-colored) in the BLA in morphine + naloxone group. Scale bar = 100 μm. (D) The density of Cre positive neurons of the POR in each group (n = 3 in saline + saline group, n = 2 in morphine + naloxone group, *p = 0.0360, compared to saline + saline group, student’s t-test). (E) The density of tdTomato positive fibers in the BLA in each group (n = 3 in each group, *p = 0.0352, compared to saline + saline group, student’s t-test). Data are shown as the mean ± SEM.

