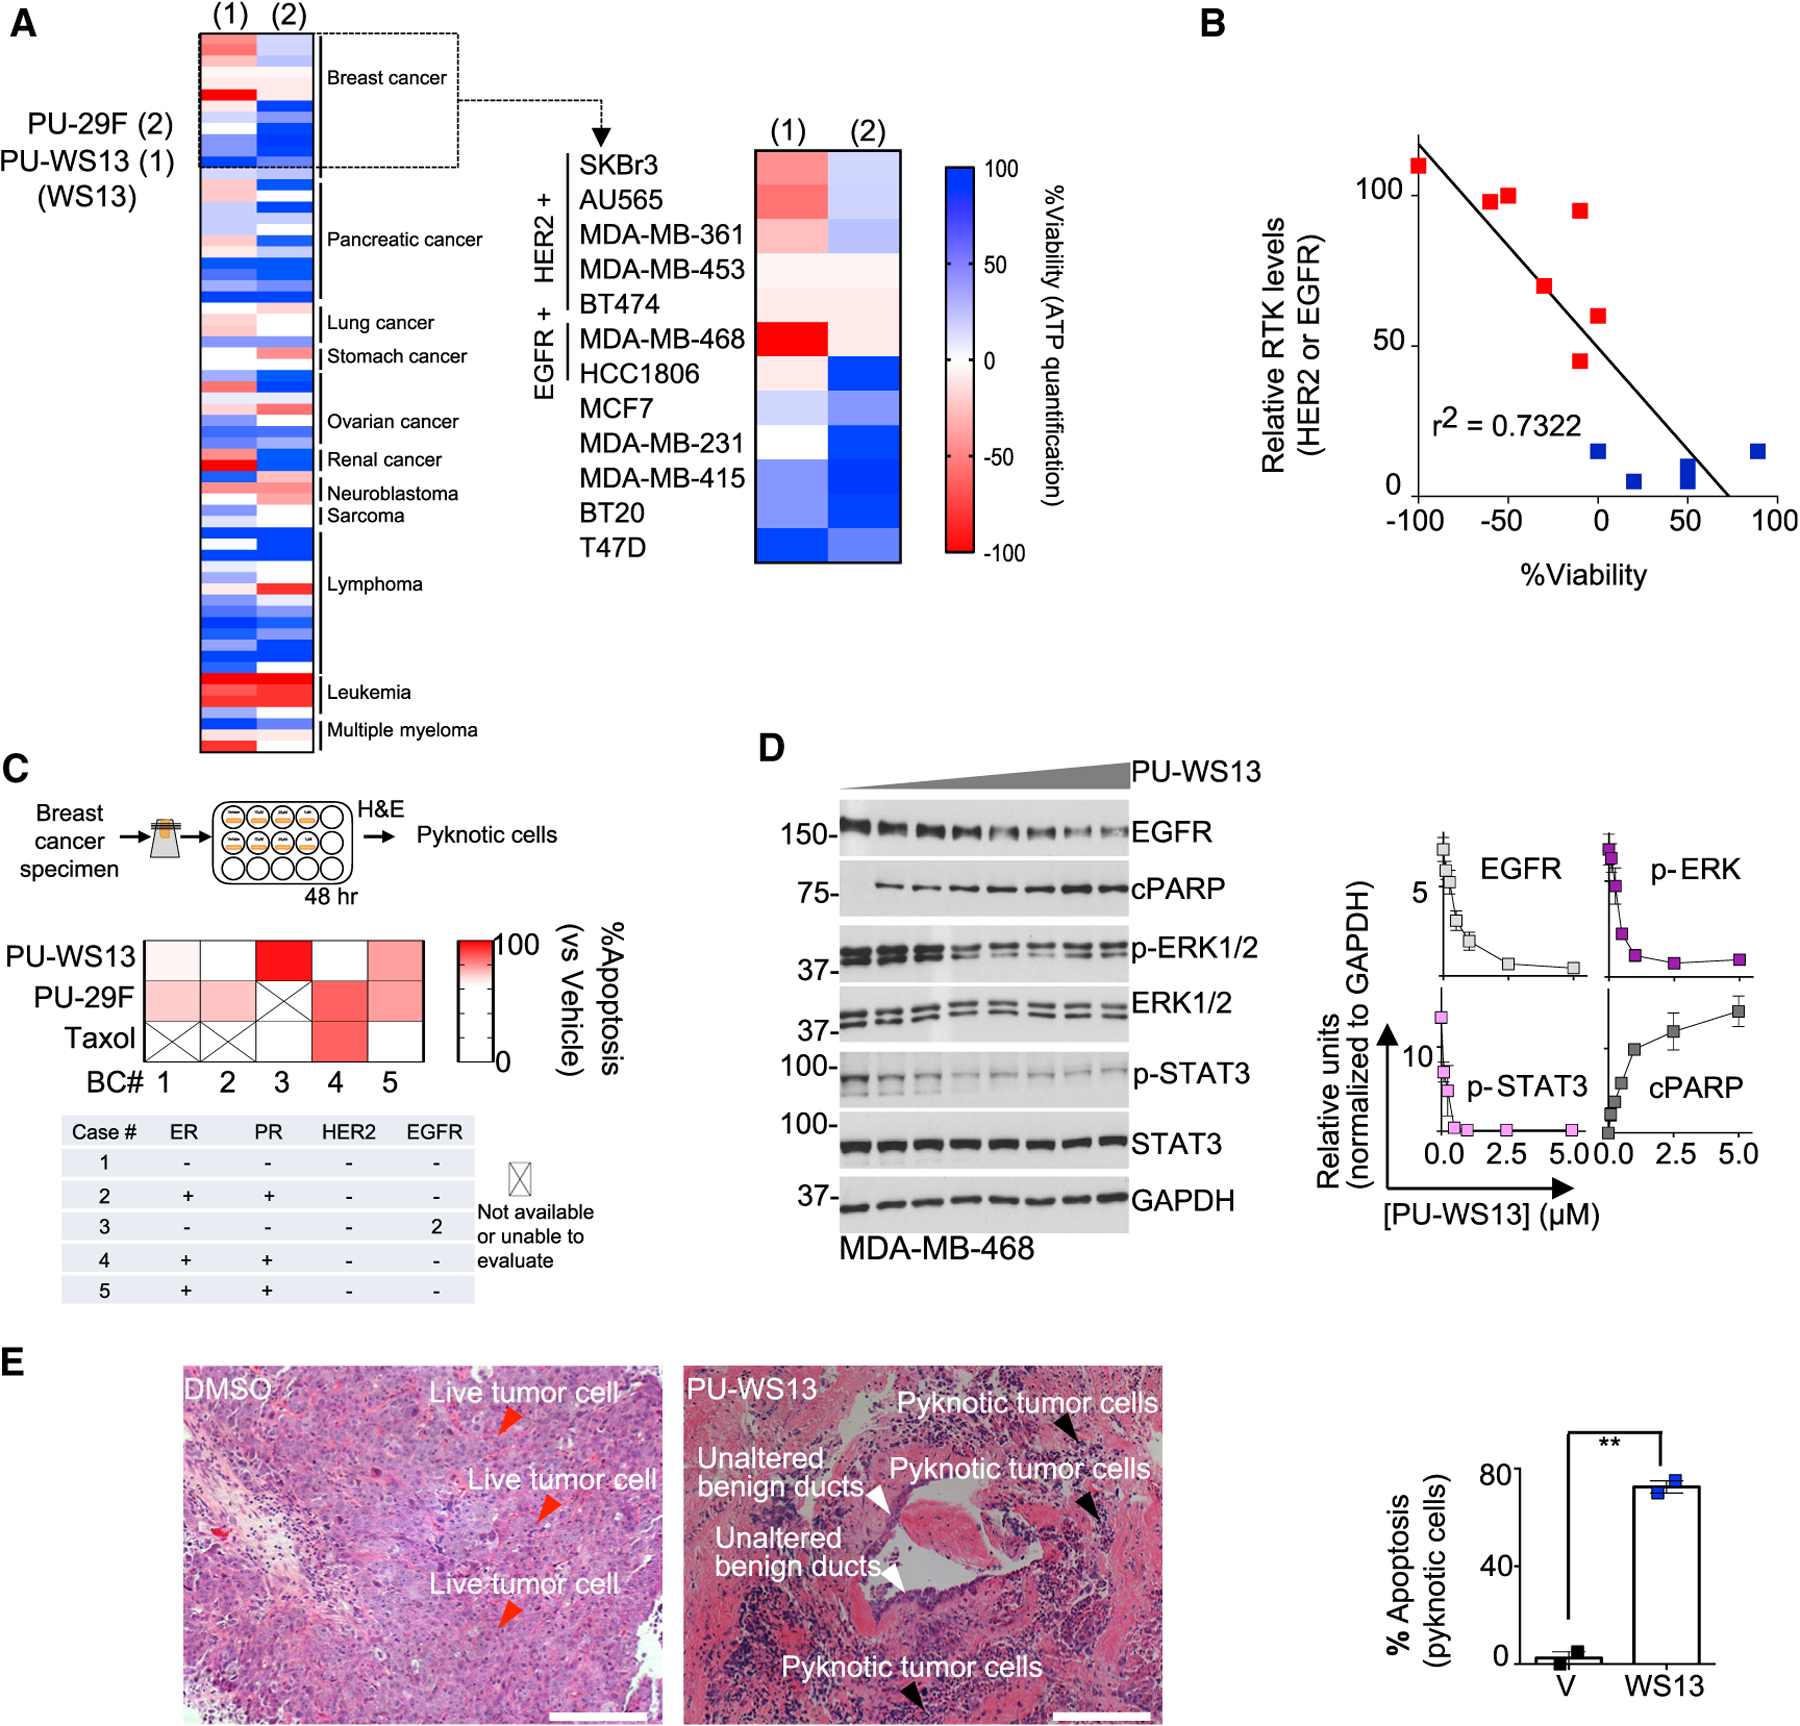
Figure 1. Sensitivity of Cancer Cells and Primary Specimens to GRP94 Inhibition by PU-WS13.

(A) Viability of cancer cell lines (n = 64) treated for 72 h with PU-WS13 (10 μM) or PU-29F (20 μM). Mean values of triplicate experiments are graphed. Negative values depict killing of the initial cell population.
(B) Correlative analysis between RTK (i.e., HER2 and EGFR) levels and cell viability for BC cells in (A). Pearson’s r, two-tailed, n = 12.
(C) Ex vivo sensitivity of primary BC explants treated for 48 h with PU-WS13 (10 μM), PU-29F (20 μM), or taxol (1 μM) evaluated as indicated in the associated schematic. Mean values from 2 slices per condition are shown.
(D) Western blot analysis of MDA-MB-468 cells treated for 24 h with PU-WS13 (0, 0.1, 0.25, 0.5, 1, 2.5, 5, and 10 μM). PU-WS13, WS13. Graph, mean of 3 independent experiments; error bars, SEM.
(E) Same as in (C) for an EGFR+ BC specimen treated with PU-WS13 (20 μM) or vehicle for 24 h. Scale bar, 200 μm.
See also Figure S1.
