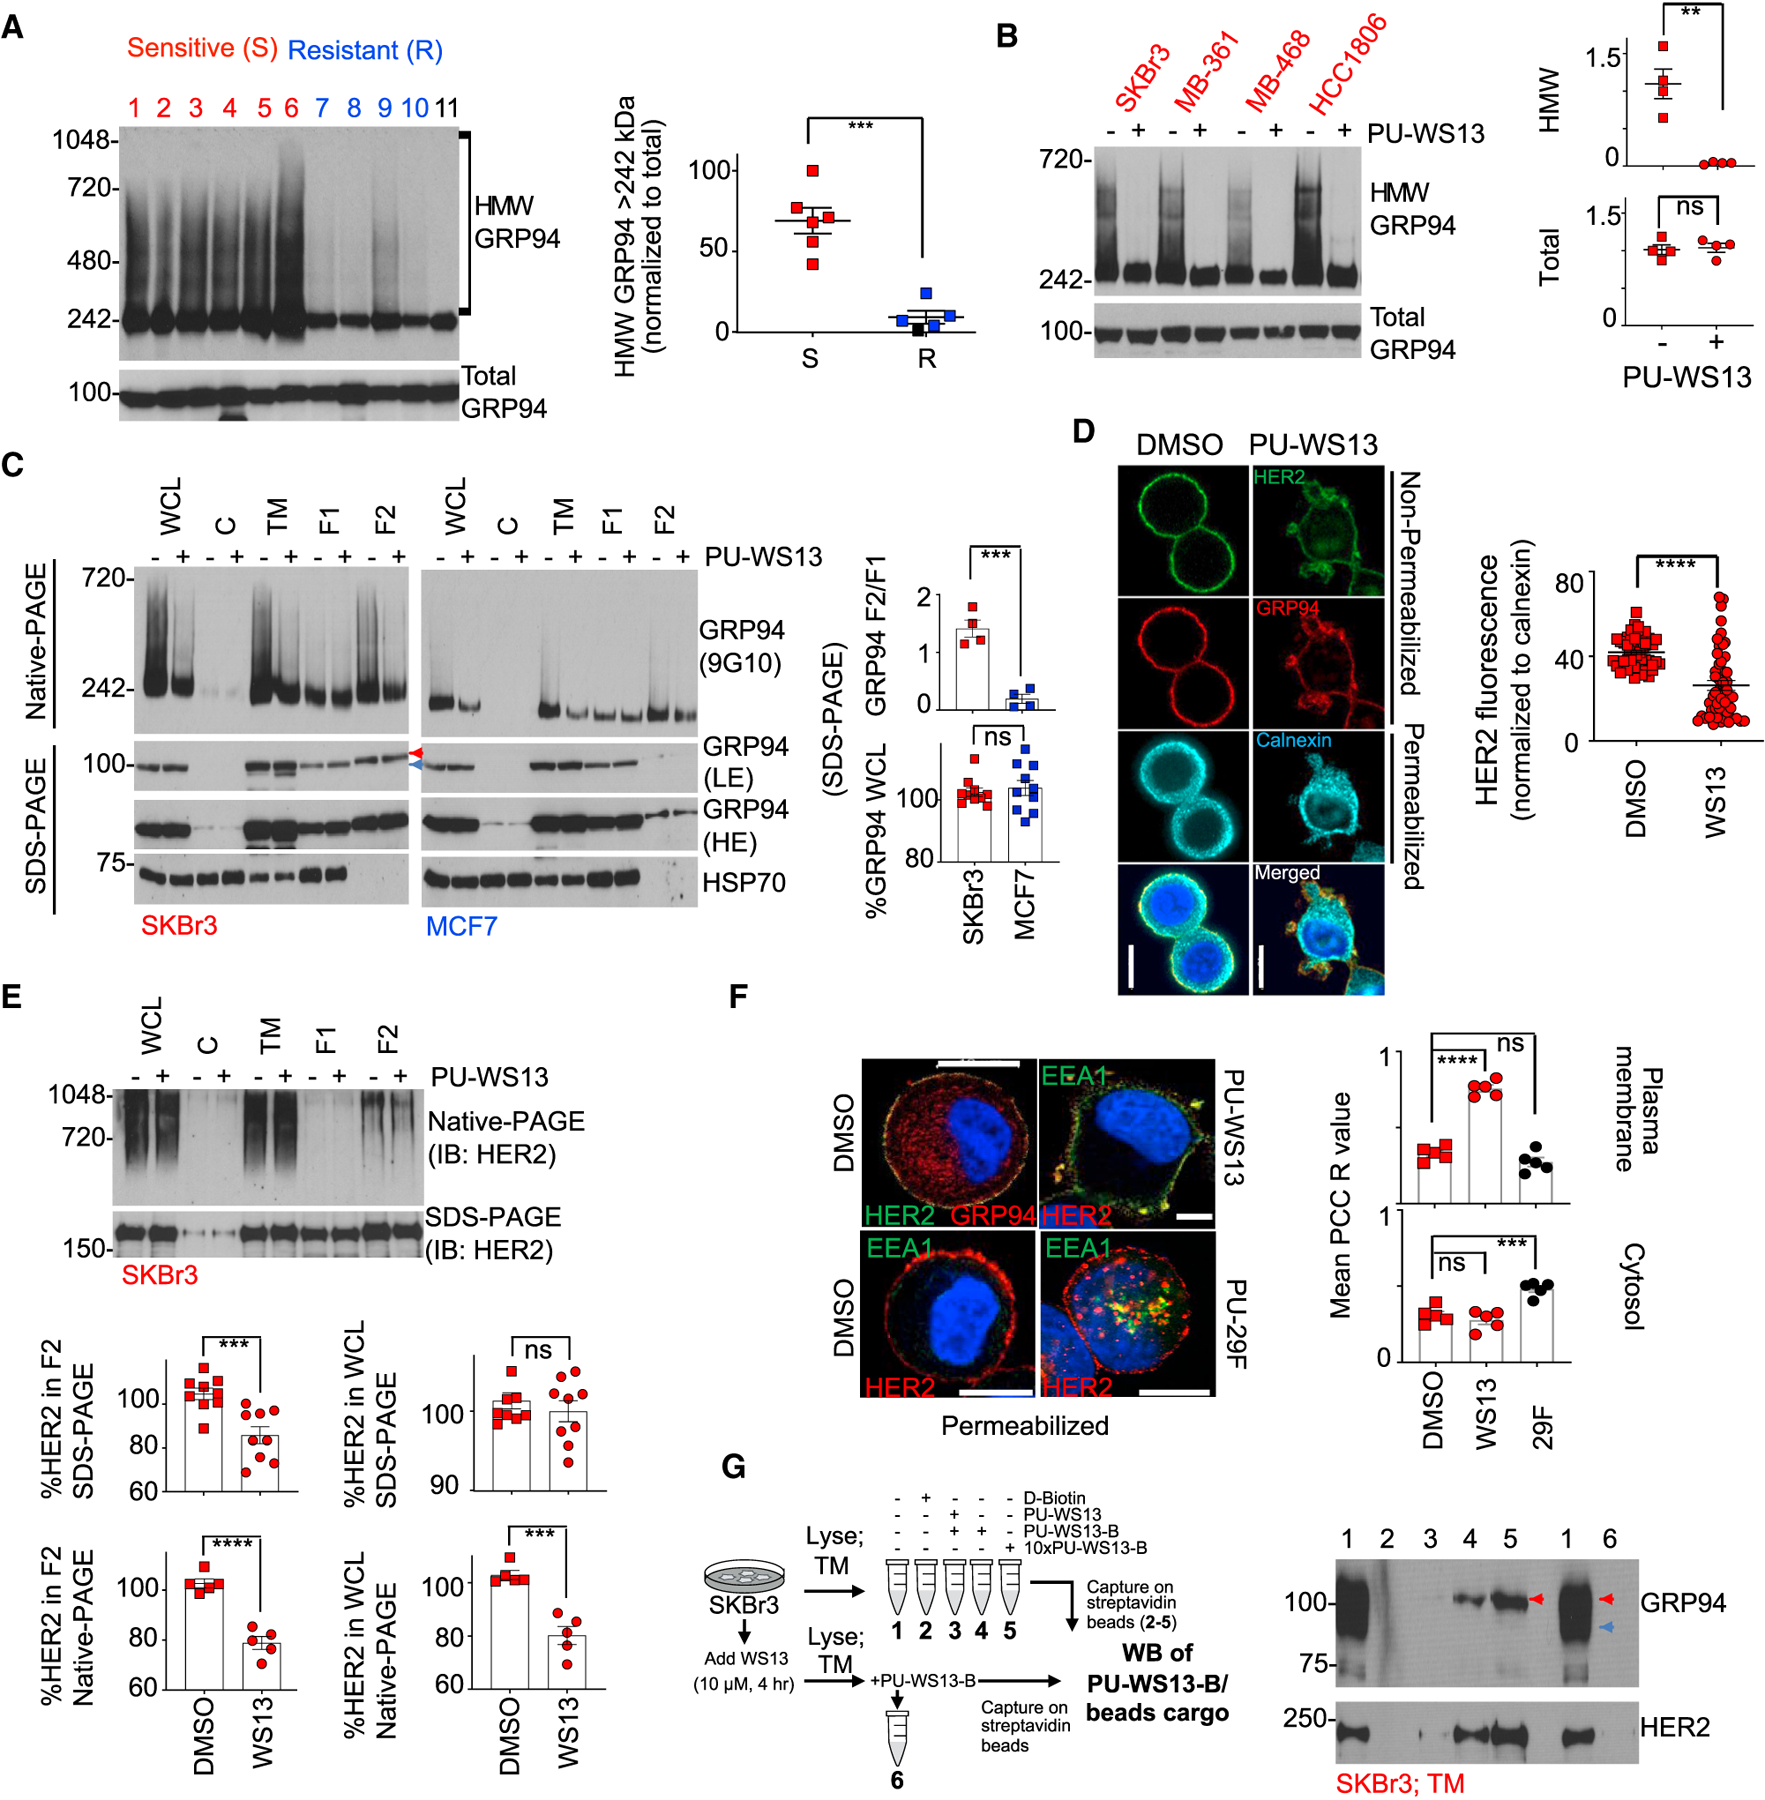
Figure 2. GRP94 Is Biochemically and Functionally Heterogeneous in Cancer Cells.

(A and B) Native-PAGE (top) and SDS-PAGE (bottom) separation followed by immunoblot with the 9G10 anti-GRP94 antibody in un-treated cell lines (A) or in those treated for 4 h with PU-WS13 (10 mM) (B). Each data point is an individual cell line; lanes 1–11 are BT474, MDA-MB-468, SKBr3, AU565, MDA-MB-361, HCC1806,MCF7, MDA-MB-231, T47D, BT20, and HMEC. Graph, mean. Error bar, SEM; unpaired t test, **p < 0.01, ***p < 0.001.
(C) Biochemical signature of GRP94 in distinct cellular compartments of a PU-WS13-sensitive (SKBr3) and a -resistant (MCF7) cell line. Cells were treated as in (B) prior to fractionation. WCL, whole cell lysate; C, cytosol; TM, total membrane; F1, cytosol and ER/Golgi; F2, plasma membrane. HSP70, cellular fractionation and loading control; LE and HE, low and high exposure, respectively. Red arrow, lower motility GRP94 specific to F2; blue arrow, higher motility GRP94 specific to F1. Graph, mean; n = 4. Error bar, SEM; unpaired t test, ***p < 0.001.
(D) Representative immunofluorescence (IF) staining of SKBr3 cells (n = 50) treated as in (B). Calnexin, ER marker; 4′,6-diamidino-2-phenylindole (DAPI), blue, nuclear stain; PU-WS13, WS13. Scale bar, 10 mm. Graph, mean. Error bar, SEM; unpaired t test, ****p < 0.0001.
(E) Same as in (C) for HER2 normalized to vehicle-treated cells. Graph, mean; n = 9 for native-PAGE and n = 5 for SDS-PAGE. Error bar, SEM; unpaired t test, ***p < 0.001.
(F) IF staining of SKBr3 cells (n = 20) treated for 4 h with vehicle (DMSO), PU-WS13 (WS13, 10 μM), or PU-29F (29F, 20 μM). Mean Pearson’s correlation coefficient (PCC) R value is shown corresponding to the colocalization of HER2 and EEA1. Scale bar, 10 μm. Graph, mean. Error bar, SEM; one-way ANOVA with Dunnett’s post hoc, ***p < 0.001, ****p < 0.0001.
(G) Western blot analysis of the protein cargo isolated by streptavidin-immobilized WS13-B (a biotinylated version of PU-WS13) from SKBr3 TM extracts. See also Figures S2 and S3.
