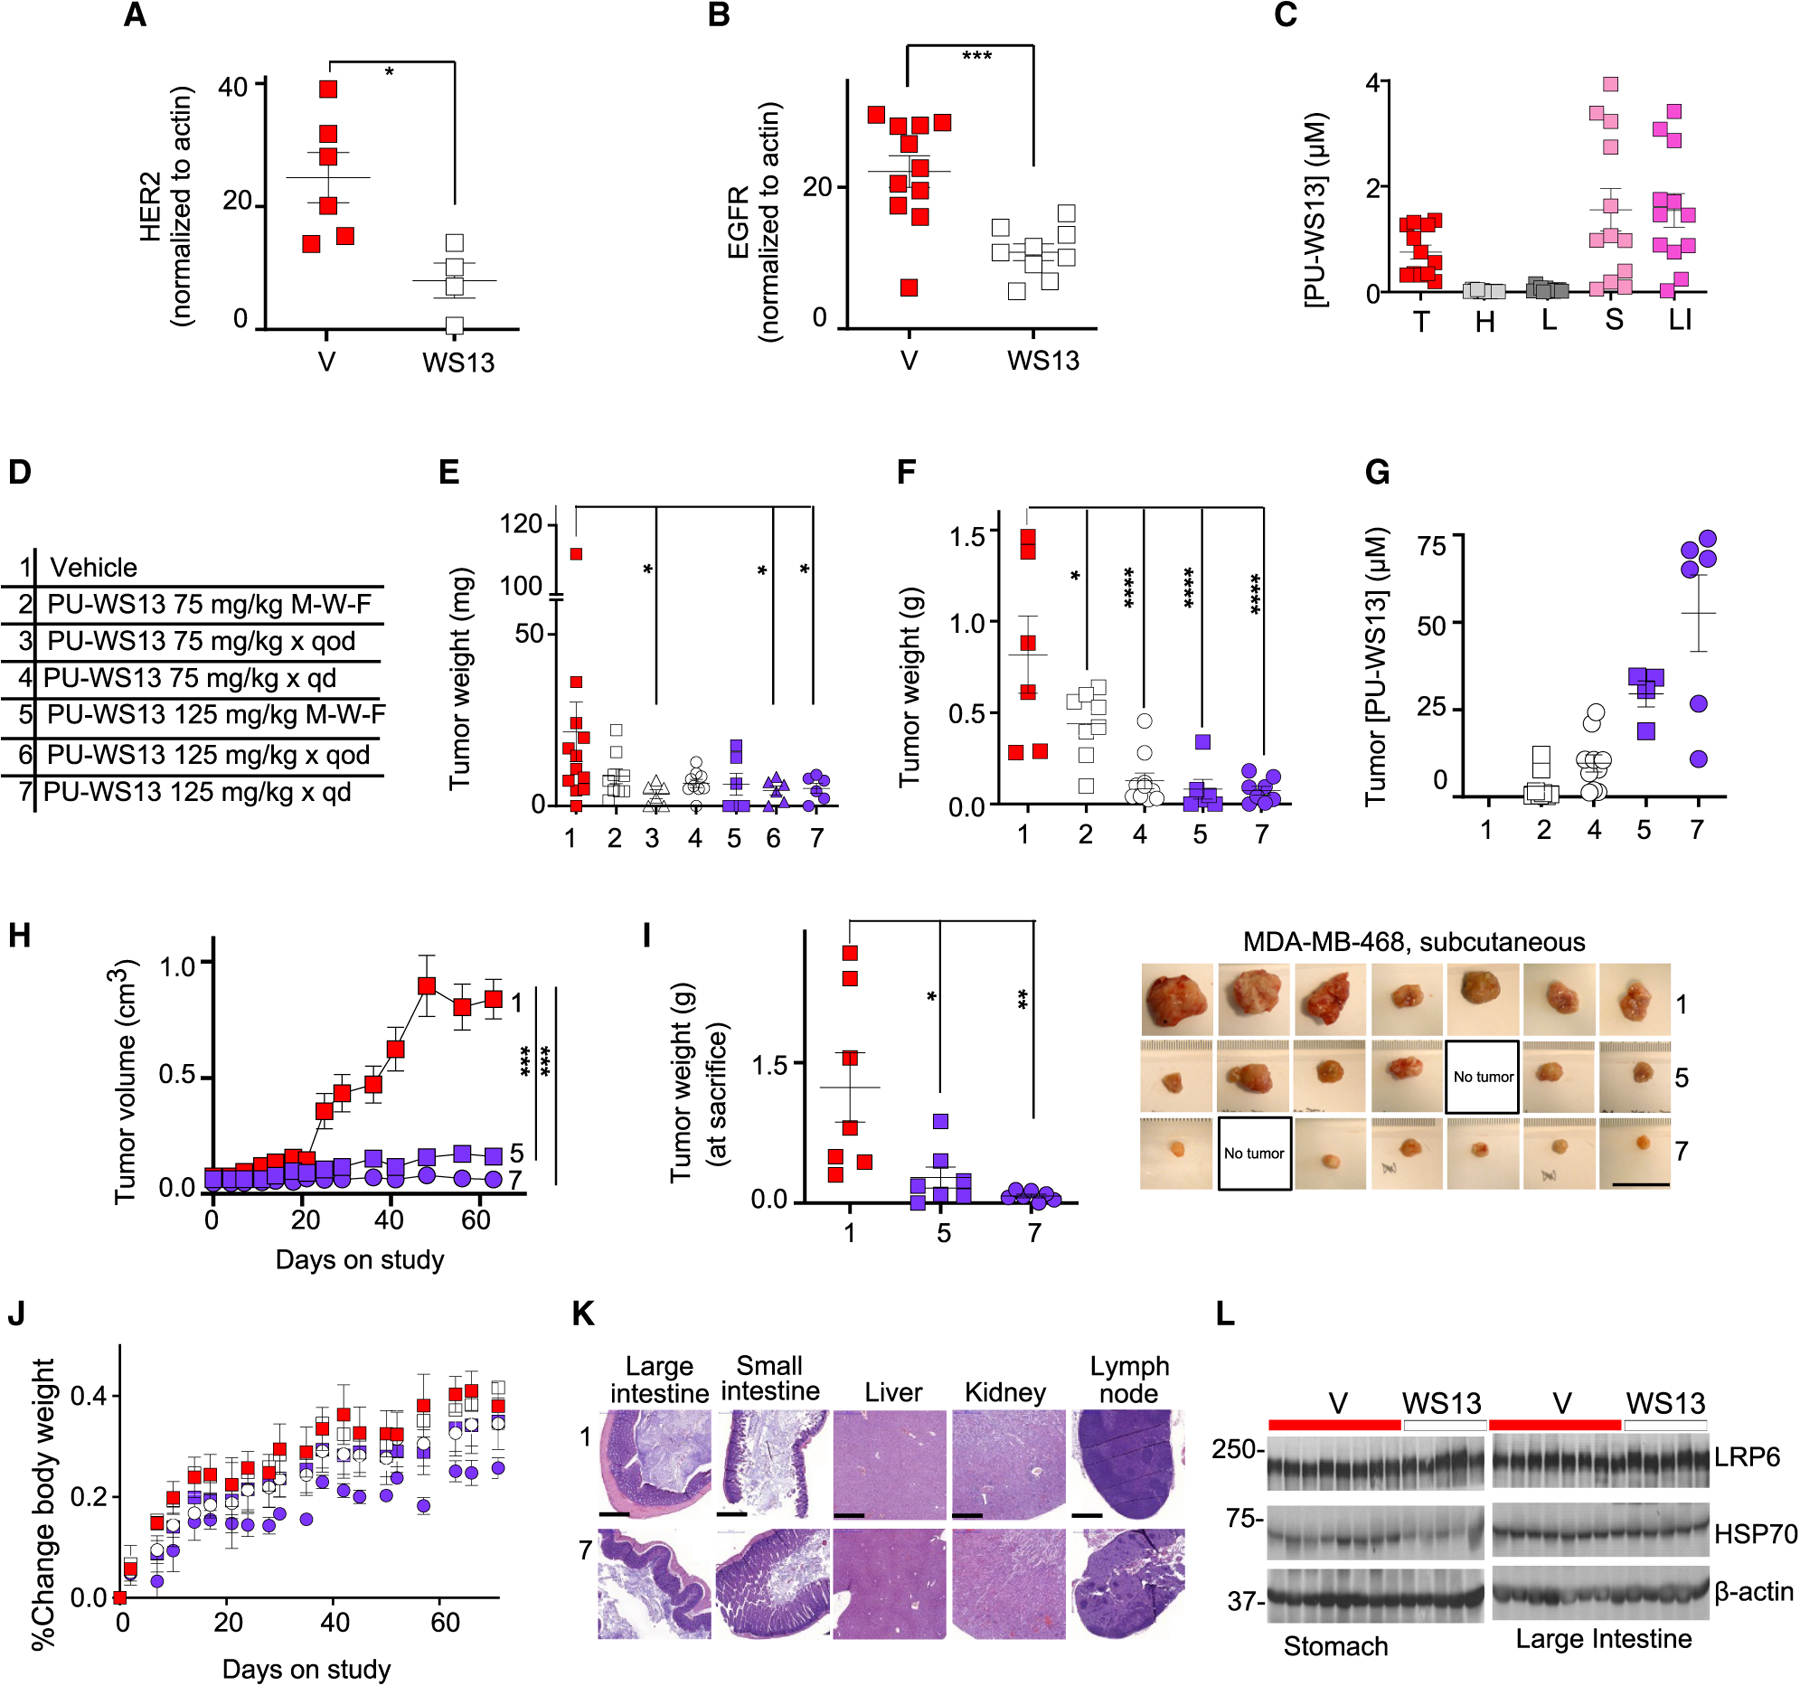
Figure 7. The HMW GRP94 Tumor Variant Is an Actionable Target.

(A and B) PD analyses at 24 h after one dose of PU-WS13 (75 mg/kg, i.p.) administered to mice bearing AU565 (A) or MDA-MB-468(B) orthotopic tumors. Graphs, mean ± SEM; n = 6 for vehicle (V) and n = 4 for PU-WS13 (WS13) for AU565; n = 11 for V and n = 9 for WS13, for MDA-MB-468; unpaired two tailed t test, ***p <0.001, *p < 0.05. See Figure S6 for representative western blot analyses.
(C) Molar concentration of PU-WS13 in individual tumors and tissues for mice (n = 12) as in (B). Graphs, mean ± SEM. T, tumor; H, heart; L, lung; S, stomach; LI, large intestine.
(D) Dose and schedule paradigms used in testing the efficacy and safety of PU-WS13. 75MWF, 75 mg/kg given Monday, Wednesday, and Friday; qod, every other day; qd, every day, Monday through Friday.
(E) Tumor weight measurements of mice as in (A) after 64 days of treatment as indicated in (D). 1, n = 12; 2, n = 9; 3, n = 6; 4, n = 9; 5, n = 6; 6, n = 6; 7, n = 6, pooled data from two experiments. Graph, mean ± SEM; two-tailed Mann Whitney test, *p < 0.05.
(F) Tumor weight measurements of mice as in (B) after 87 days of treatment as indicated in (D). 1, n = 6; 2, n = 8; 4, n = 10; 5, n = 6; 7, n = 8, pooled data from two experiments. Graph, mean ± SEM; one-way ANOVA, Dunnett’s multiple comparisons, *p < 0.05, ****p < 0.0001.
(G) Concentration of PU-WS13 in individual tumors as in (F).
(H) Tumor volume monitoring during treatment as in (D) of mice bearing subcutaneous MDA-MB-468 tumors. Graph, mean ± SEM; n = 7 per cohort; two-way ANOVA, ****p < 0.0001.
(I) Tumor weight measurements of mice as in (H). Graph, mean ± SEM; one-way ANOVA, Dunnett’s multiple comparisons, *p < 0.05, **p < 0.01. Picture of individual tumors is also shown. No tumor, no macroscopic tumor evident at sacrifice. Scale bar, 2.5 cm.
(J) Body weight monitoring of mice as in (F). Graph, mean ± SD.
(K) H&E-stained tissues and organs from cohorts 1 and 7 as in (F). Scale bar, 500 μm.
(L) Western blot of indicated tissues from individual mice treated as in (B). LRP6, control for HMW GRP94 selectivity; HSP70, control for GRP94 over HSP90 selectivity.
See also Figure S7.
