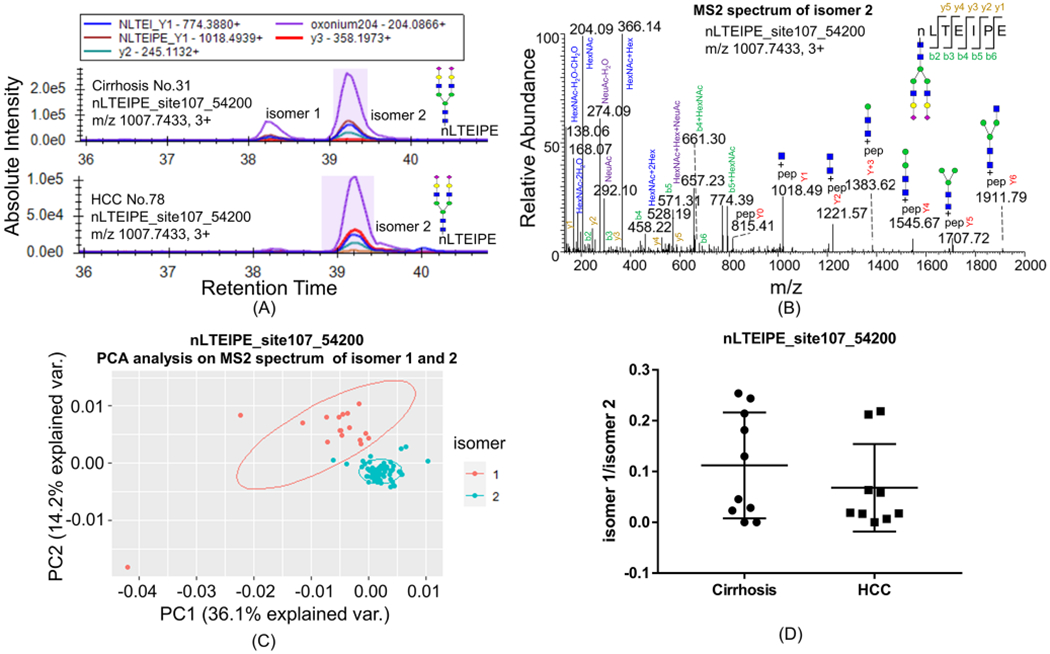
Figure 1.

Isomers of glycopeptides nLTEIPE_54200 on a C18 column with the PRM method. (A) Most cirrhosis samples have both isomers 1 and 2 of nLTEIPE_54200 (top), whereas only a few early-stage HCC have both isomers (bottom). (B) MS2 spectrum of isomer 2. (C)PCA analysis of MS2 spectra of isomer 1 and isomer 2. MS2 spectra with ≥3 Y ions were included for analysis (total 77 scans); common fragments from all spectra (<20 ppm) were used as variables; peak intensity was converted to square root and normalized as a percentage of total summed intensity before PCA analysis. (D) Ratio of isomer1/isomer 2 in cirrhosis and early-stage HCC samples does not show a significant difference with Student’s t test.
