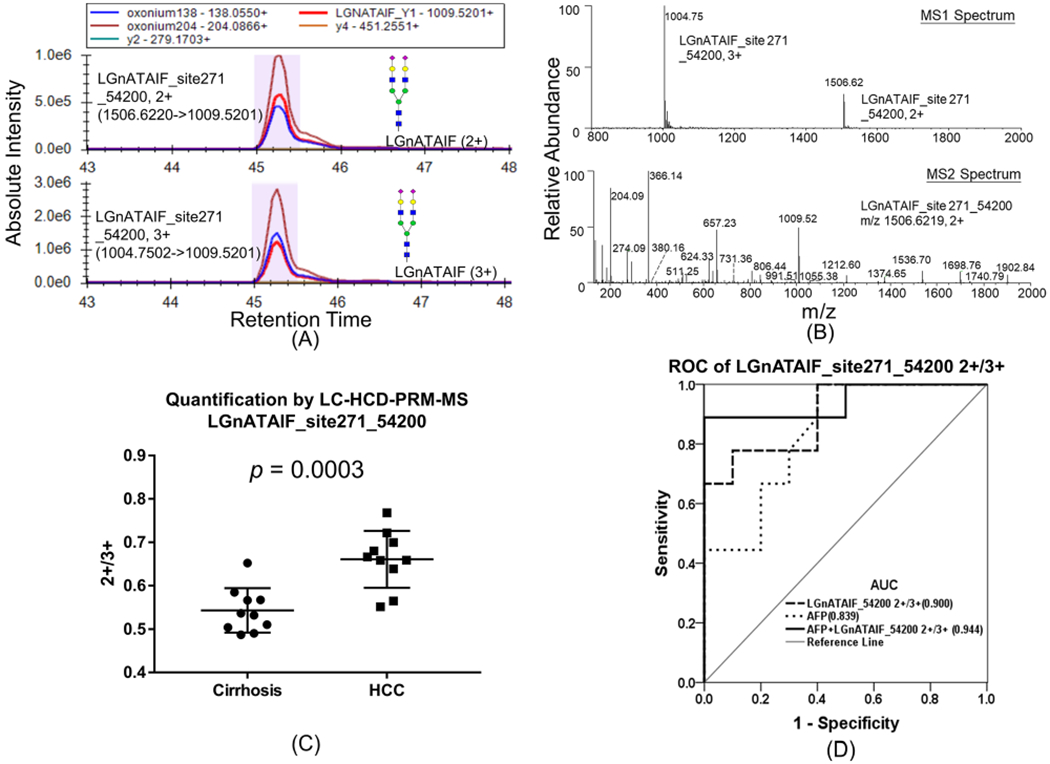
Figure 3.

(A) PRM quantification of glycopeptide LGnATAIF_54200 2+ (top) and LGnATAIF_54200 3+ (bottom). (B) MS1 spectrum of parent ions with two charge states (top), and MS2 spectrum of charge 2+ state (bottom). (C) Relative abundance of glycopeptide LGnATAIF_54200 2+/3+ in cirrhosis and HCC patients. (D) ROC analysis of LGnATAIF_54200 2+/3+ in patients.
