
Figure 1.
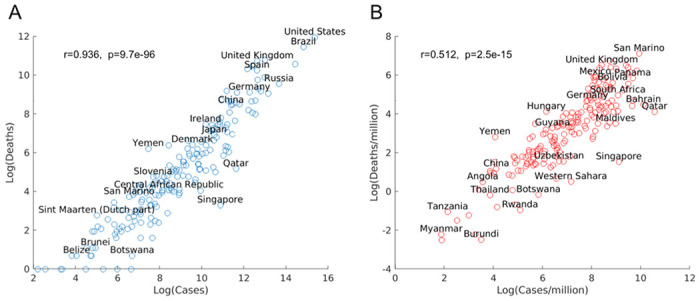
(A) Scatter plots in log scale of COVID-19 cases and deaths. (B) Scatter plots in log scale of COVID-19 cases and deaths per million. Only a subset of countries is labeled above its marker.
Official websites use .gov
A
.gov website belongs to an official
government organization in the United States.
Secure .gov websites use HTTPS
A lock (
) or https:// means you've safely
connected to the .gov website. Share sensitive
information only on official, secure websites.
(A) Scatter plots in log scale of COVID-19 cases and deaths. (B) Scatter plots in log scale of COVID-19 cases and deaths per million. Only a subset of countries is labeled above its marker.