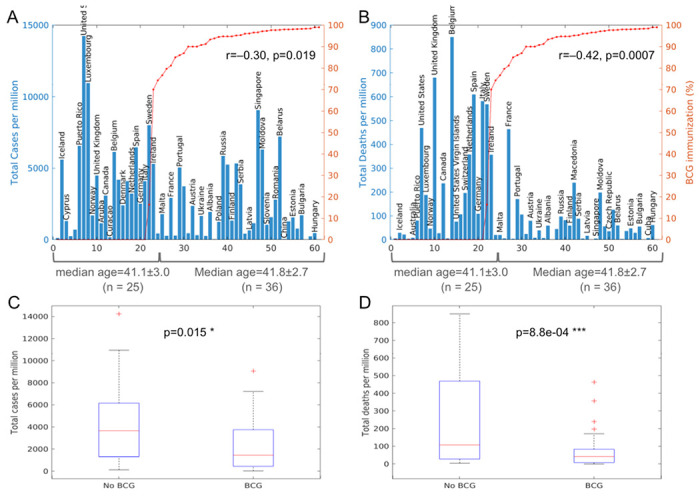
Figure 4.

COVID-19 morbidity and mortality vs BCG immunization in ‘old’ countries (A, B) Total COVID-19 cases and deaths per million against BCG immunization rates for high median age (“old”) countries and regions (n=61). r and p are from Pearson’s correlation coefficient analysis. (C, D) Boxplots of total COVID-19 cases and deaths per million ‘old” all countries in the world (n=61), grouped by BCG vaccination rate of either <50% (‘No BCG”) or ≥50% (BCG). P values indicate the levels of difference between the two groups by two-tailed Student’s t-test.
