Figure 5.
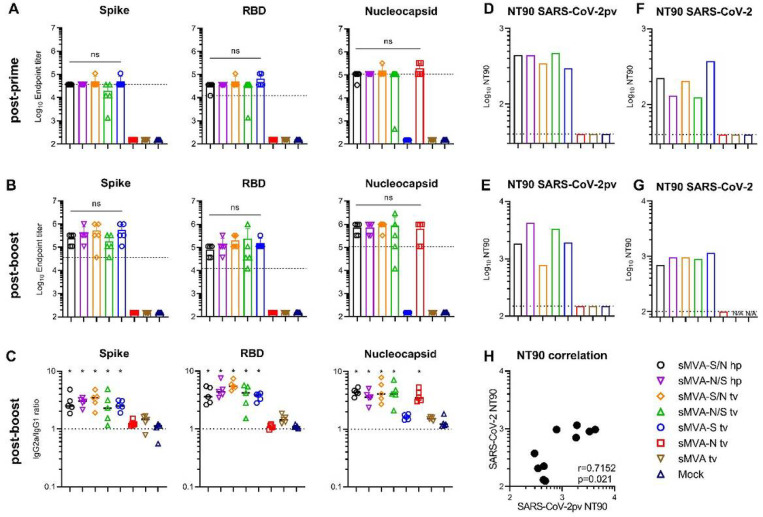
Humoral immune responses stimulated by sMVA-CoV2 vectors. Balb/c mice immunized twice in a three week interval with 5×10⁷ PFU of the single and double recombinant sMVA-CoV2 vectors derived with FPV HP1.441 (sMVA-S/N hp and sMVA-N/S hp) or TROVAC (sMVA-S/N tv, sMVA-N/S tv, sMVA-S tv, sMVA-N tv) were evaluated for SARS-CoV-2-specific humoral immune responses A-B) Binding antibodies. S, RBD, and N-specific binding antibodies induced by the vaccine vectors were evaluated after the first (A) and second (B) immunization by ELISA. Dashed lines in A and B indicate median binding antibody endpoint titers measured in convalescent human sera (Figure S4). One-way ANOVA with Tukey’s multiple comparison test was used to evaluate differences between binding antibody end-point titers. C) IgG2a/IgG1 isotype ratio. S-, RBD-, and N-specific binding antibodies of the IgG2a and IgG1 isotype were measured after the second immunization using 1:10,000 serum dilution, and absorbance reading was used to calculate IgG2a/IgG1 antibody ratio. One-way ANOVA with Dunnett’s multiple comparison test was used to compare each group mean IgG2a/IgG1 ratio to a ratio of 1 (balanced Th1/Th2 response). D-G) NAb responses. SARS-CoV-2-specific NAb (NT90 titer) induced by the vaccine vectors were measured after the first (D, F) and second (E, G) immunization against SARS-CoV-2 pseudovirus (pv) (D-E) or infectious SARS-CoV-2 virus (F-G) in pooled sera of immunized mice. Shown is the average NT90 measured in duplicate (D-E) or triplicate (F-G) infection. N/A=failed quality control of the samples. Dotted lines indicate lowest antibody dilution included in the analysis. H) SARS-CoV-2/SARS-CoV-2pv correlation analysis. Correlation analysis of NT90 measured in mouse sera after one and two immunizations using infectious SARS-CoV-2 virus and SARS-CoV-2pv. Pearson correlation coefficient (r) was calculated in H. *p<0.05. ns= not significant.

