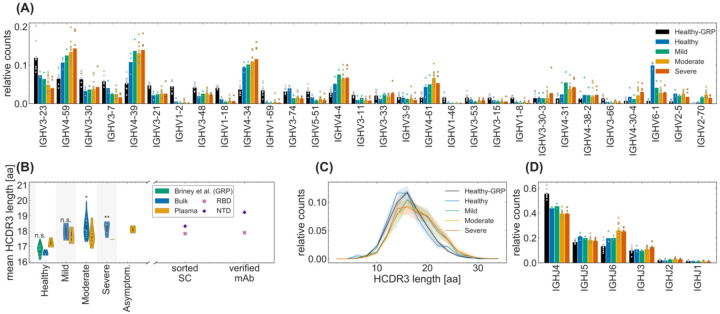
Figure 2. Sequence features of immune receptors in the bulk repertoire across cohorts.
(A) The relative counts for IGHV-gene usage is shown for inferred naïve progenitors of clonal lineages in cohorts of healthy individuals and COVID-19 cohorts of patients exhibiting mild, moderate, and severe symptoms. The bars indicate the usage frequency averaged over individuals in each cohort, and dots indicate the variation in V-gene frequencies across individuals within each cohort. (B, C) Statistics of length of HCDR3 amino acid sequence is shown for different patients in each cohort. The violin plots in (B) show the mean HCDR3 length of each patient (dots) in a given cohort (color), with violin plot cut parameter set to 0.1. The mean HCDR3 lengths of the sorted single cells and verified monoclonal antibodies (axis) for RBD-reactive (pink squares) and NTD-reactive (purple pluses) receptors are shown on the right. Full lines in (C) show distributions averaged over individuals in each cohort (color), and shadings indicate regions containing one standard deviation of variation across individuals within a cohort. One-way ANOVA statistical tests were performed comparing the means HCDR3 of all the COVID-19 cohort and the healthy repertoires from Great Repertoire Project (GRP) dataset (Briney et al. 2019), with the healthy control from this study: Healthy-Mild: F1,3 = 12.0, p-value = 0.04; Healthy-Moderate: F1,13 = 15.7, p-value = 0.0016; Healthy-Severe: F1,6 = 37.5, p-value = 0.00087; Healthy-GRP: F1,11 = 0.9), p-value = 0.359. Significance cutoffs: n.s. p – value > 0.01, * p – value ≤ 0.01, ** p – value < 0.001. (D) The relative counts for IGHJ-gene usage is shown for inferred naive progenitors of clonal lineages in cohorts of healthy individuals and COVID-19 cohorts of patients exhibiting mild, moderate, and severe symptoms. The bars indicate the usage frequency averaged over individuals in each cohort, and dots indicate the variation in J-gene frequencies across individuals within each cohort.

