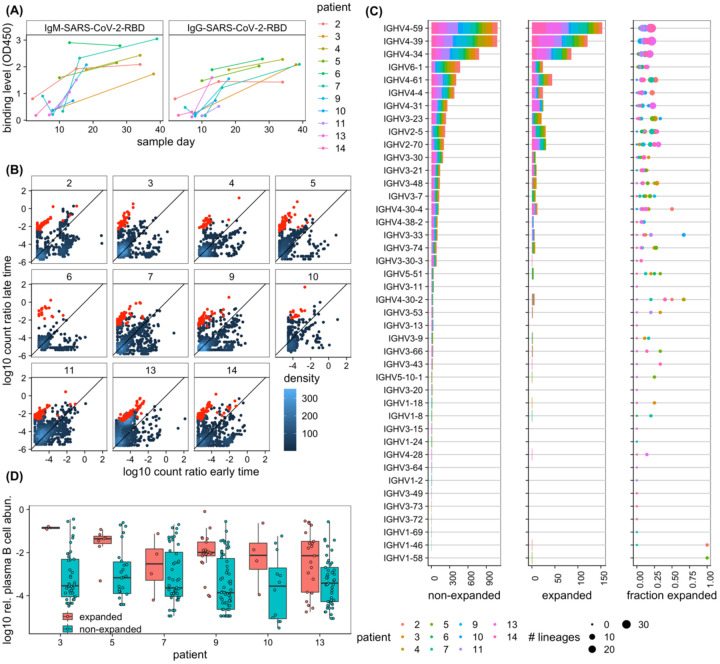
Figure 4. Dynamics of BCR repertoires during infection.
(A) The binding level (measured by OD450 in ELISA assay) of the IgM (left) and IgG (right) repertoires to SARS-CoV-2 (RBD) epitopes increases over time in most individuals. (B) The log-ratio of BCR (mRNA) abundance at late time versus early time is shown for all clonal lineages that are present at least in two time points (see Methods). Each panel shows dynamics of lineages for a given individual, as indicated in the label. The analysis is shown in individuals for whom the binding level (OD450) of the IgG repertoire increases over time (shown in (A)). The count density indicates the number of lineages at each point. Lineages that show a significant expansion over time are indicated in red (see Methods for estimation of associated p-values). (C) IGHV-gene usage of lineages is shown for non-expanded (left) and expanded (middle) lineages in all individuals (colors). The right panel shows, for each patient (colors), the fraction of expanded lineages with a given IGHV gene as the number of expanded lineages divided by the total number of lineages with that given IGHV gene. The size of the circles indicates the total number of lineages in each category. (D) Boxplot of log10 relative read abundance in the plasma B-cell (Methods) are shown for expanding (red) and non-expanding (cyan) lineages that contain reads from the plasma B-cell in different patients. Receptors from the plasma B-cell are significantly more abundant in expanding lineages in a number of patients based on the ANOVA test statistics: patient 3: F1,42 = 5.4, p-value = 0.02; patient 5: F1,31 = 0.5, p-value = 0.5; patient 7: F1,49 = 0.01, p-value = 0.91; patient 9: F1,42 = 4.1, p-value = 0.04; patient 10: F1,42 = 2.9, p-value = 0.1; patient 13: F1,64 = 7.7, p-value = 0.007.

