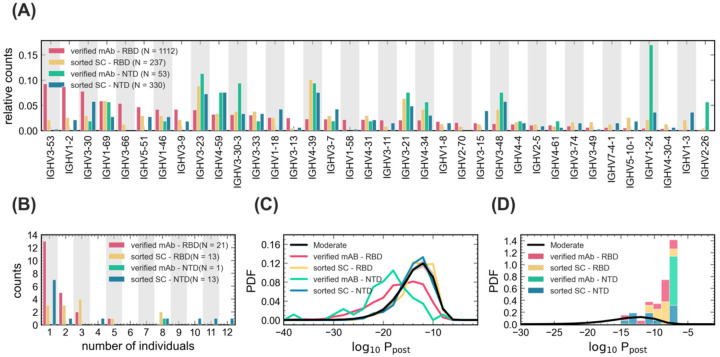
Figure 6: Statistics of BCRs reactive to RBD and NTD epitopes.
(A) The relative counts for IGHV-gene usage is shown for known mAbs (Table S8) reactive to RBD (pink) and NTD (green) epitopes of SARS-CoV-2 and for receptors obtained from single cell sequencing of the pooled sample from all patients (Methods), sorted for RBD (yellow) and NTD (blue) epitopes. (B) The histogram shows the number of NTD-sorted receptors from single cell sequencing (Table S6) and RBD- and NTD-specific verified mAbs (Table S7) found in the bulk+plasma B-cell repertoires of a given number of individuals (Methods), indicated on the horizontal axis. (C) The distribution of the log-probability to observe a sequence σ in the periphery log10 Ppost(σ) is shown as a normalized probability density function (PDF) for inferred naïve progenitors of known RBD- and NTD-sorted receptors from single cell sequencing. Ppost(σ) values were evaluated based on the repertoire model created from patients with moderate symptoms. The corresponding log10 Ppost distribution for bulk repertoires of the moderate cohort (similar to Fig. 3A) is shown in black as a reference. (D) Similar to (C) but restricted to receptors that are found in the bulk+ plasma B-cell repertoire of at least one patient in the cohort (Tables S6, S7). Colors are consistent between panels and the number of samples used to evaluate the statistics in each panel is indicated in the legend.

