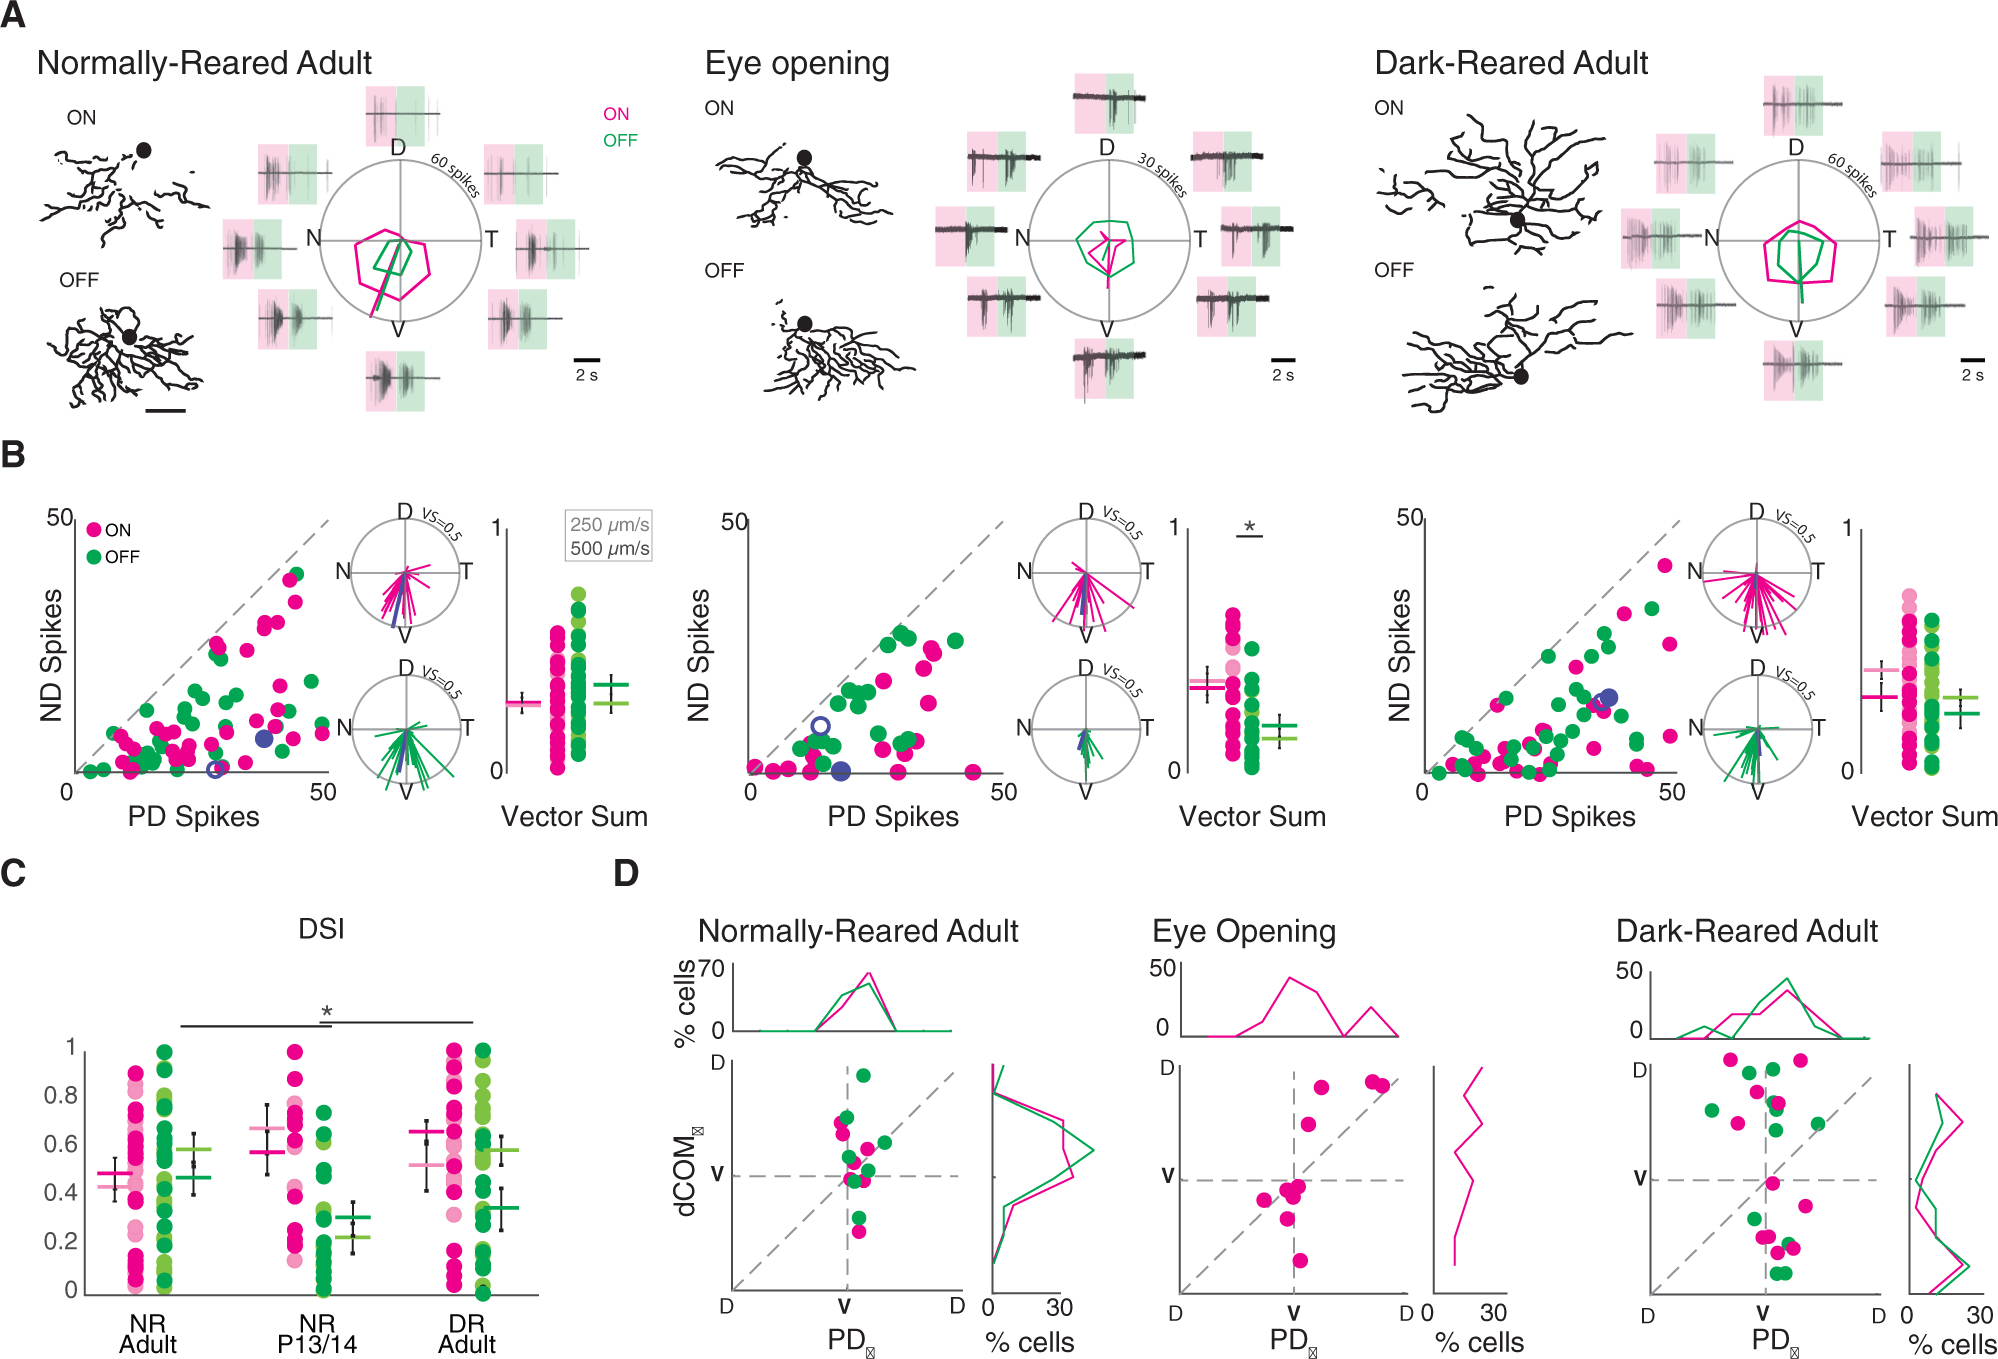
Figure 2. Ventral Motion Preference Is Preserved in Dark-Reared Mice Despite Altered vDSGC Dendritic Morphology.

(A) Example dendritic skeletons of normally reared adult (left), eye opening (middle), and dark-reared adult (right) vDSGCs next to the average spike responses of the same cells. Shaded boxes define windows over which ON (magenta) and OFF (green) responses are assessed. Tuning curves plotted in polar coordinates ON (magenta) and OFF (green) responses. Radius of tuning curve = 60 spikes for adult and 30 spikes for eye opening. Scale bar = 100 μm.
(B) Population data represented as number of spikes fired for null direction (ND) versus preferred direction (PD) spiking (left) and as vectors in polar plots (middle inset) of normally reared adult (left, n = 39), eye opening (middle, n = 21), and dark-reared adult (right, n = 32) vDSGCs. Radius of polar plot: normalized vector sum (VS) of tuning curve = 0.5, blue data points refer to ON (filled) and OFF (open) responses of example cell above. Comparison of spike tuning using the magnitude of the normalized vector sum of the tuning curve (right inset) at two velocities (lighter shade, 250 μm/s; darker shade, 500 μm/s) for ON (magenta) and OFF (green) responses. Colored horizontal bar denotes mean; error bars denote SEM. Significance within conditions was assessed using unpaired t test: *p250μm/s = 0.005, p500μm/s = 0.05. Significance across conditions was assessed using one-way ANOVA for ON and OFF responses separately: pON = 0.08, pOFF = 0.02. Tukey-Kramer post hoc test: p > 0.05.
(C) Comparison of spike tuning using direction selectivity index (DSI) at two velocities (lighter shade, 250 μm/s; darker shade, 500 μm/s) for ON (magenta) and OFF (green) responses. Colored horizontal bar denotes mean; error bars denote SEM. Significance was assessed using one-way ANOVA for ON and OFF responses separately: pON = 0.11, pOFF = 0.0022. Tukey-Kramer post hoc test: *pOFF (NRadult-P13/P14) = 0.02.
(D) Comparison of dendritic orientation (dCOMѲ) versus spiking directional preference (PDѲ), for normally reared adult (left, n = 12), eye opening (middle, n = 18), and dark-reared adult (right, n = 16) vDSGCs. X and y axes centered on ventral axis (V). Top inset: histogram illustrating vDSGC spiking angle. Right inset: histogram illustrating vDSGC dendritic orientation. Note that P13/P14 OFF responses were excluded from this analysis because of weak tuning (see Figure 2C). Mean ± SD values are presented in Table S2.
