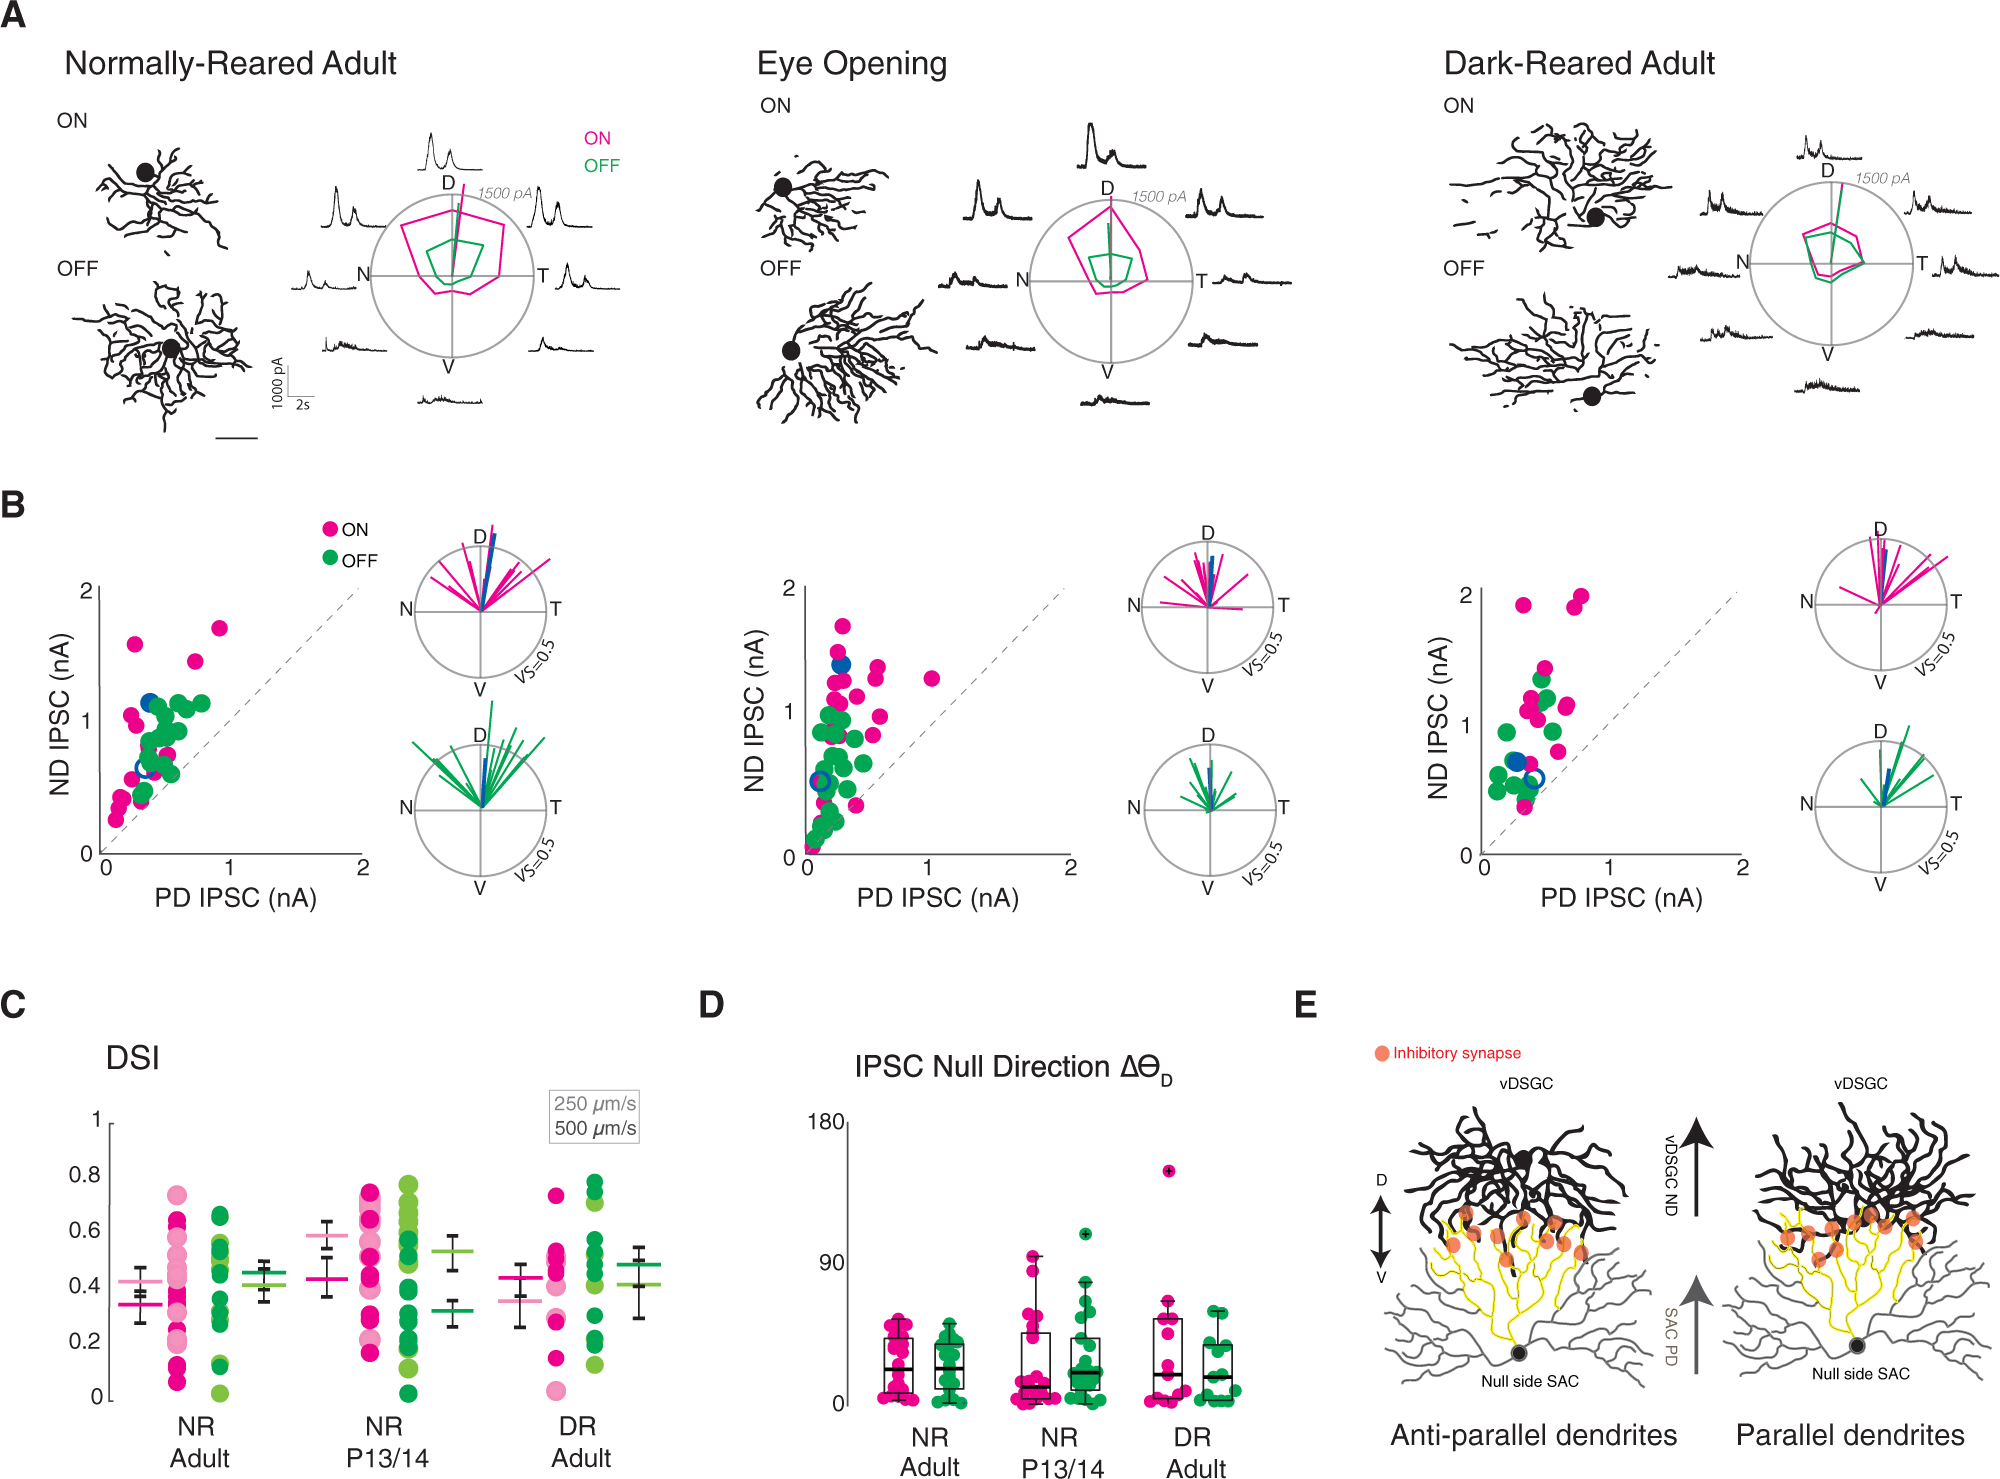
Figure 4. Asymmetric Inhibition Is Maintained in Dark-Reared vDSGCs.

(A) Example dendritic skeletons of normally reared adult (left), eye opening (middle), and dark-reared adult (right) vDSGCs next to the average inhibitory currents of the same cells. Tuning curves plotted in polar coordinates ON (magenta) and OFF (green) responses. Radius of tuning curve = 1,500 pA. Scale bar = 100 μm.
(B) Left inset: population data for normally reared adult (left, n = 23), eye opening (middle, n = 22), and dark-reared adult (right, n = 13) vDSGCs represented as peak amplitude of inhibitory postsynaptic current (IPSC) recorded for null direction (ND) versus preferred direction (PD) stimulation. Right inset: polar plot for normalized vector sums of population IPSC tuning curves. Radius of polar plot: vector sum of tuning curve = 0.5. Blue data points refer to ON (filled) and OFF (open) example cell above.
(C) Tuning strength vDSGC inhibitory input, across two stimulus velocities (lighter shade, 250 μm/s; darker shade, 500 μm/s) quantified as the direction selectivity index (DSI) for normally reared (NR) adult, eye opening (NR P13/P14), and dark-reared (DR) adult. Colored horizontal bar denotes mean; error bars denote SEM. Statistical significance was assessed using one-way ANOVA: p > 0.05.
(D) Summary data for deviation of preferred direction of IPSC tuning of vDSGCs (ND) from the dorsal (90°) axis for all three conditions. Horizontal bar denotes median. Boxplots represent variance. Kruskal-Wallis test: p > 0.05. (E) Antiparallel SAC-vDSGC wiring (Briggman et al., 2011), whereby vDSGCs preferentially synapse with null side SACs such that SAC preferred direction (PD) is aligned with vDSGC null direction (ND), schematized under two dendritic geometries. Left: vDSGCs with ventrally oriented dendrites synapse with null-side SACs where dendrites are oriented antiparallel to each other, right: vDSGCs with misoriented dendrites synapse with null-side SACs where dendrites are oriented parallel to each other.
Mean ± SD values are presented in Table S3.
