Fig. 10.
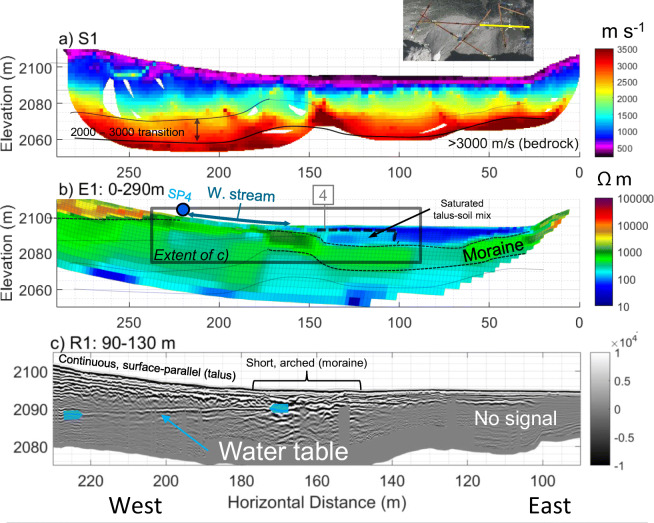
Geophysical images crossing west to east across the meadow: a P-wave velocity model (RMS = 1.8 ms) along S1 (east segment); b electrical resistivity model from E1 (absolute error = 4.8%); c radar reflection image from R1. Black solid and dashed lines (a–b) indicate boundaries interpreted from that data set, whereas semi-transparent lines indicate boundaries interpreted from the other geophysical models. Other annotations include: tie points with line 4 at approximately 140 m (grey box with “4”) and springs (blue circle). See Fig. 3 for line locations

