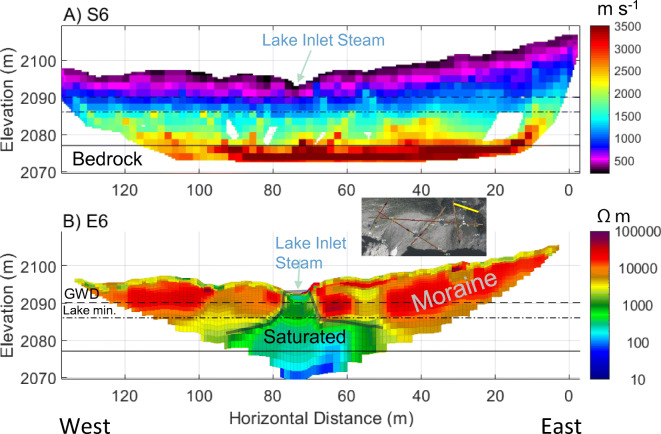
Fig. 11.
Geophysical models from the moraine along the south side of Hathataga Lake: a P-wave velocity model from S6 (RMS = 3.5 ms); b electrical resistivity model from ERT6 (absolute error = 9.9%). Annotations note the elevation of groundwater discharge points (GWD) on the south shore of Hathataga Lake (dashed black line), the minimum elevation of the lakebed (dot-dashed line), the interpreted depth to bedrock (solid black line), and the location of the inlet stream from the meadow to the lake (blue arrow), and the saturated zone below the lake inlet (semi-transparent solid line). See Fig. 3 for line locations

