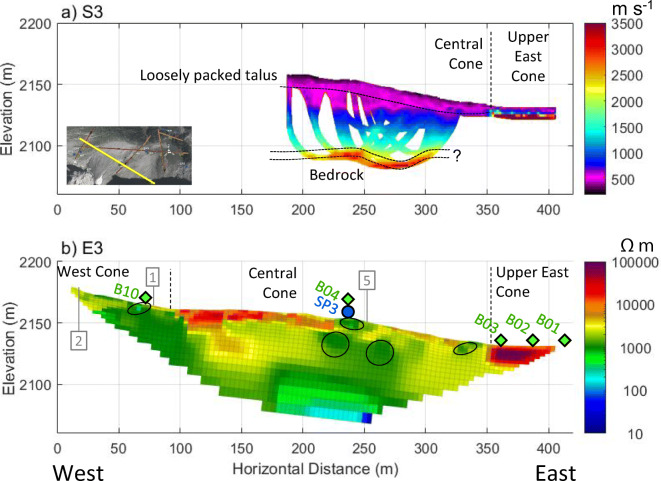
Fig. 6.
Geophysical Line 3 crossing West Cone and Central Cone. a P-wave velocity model from S3, with RMS = 2.1 ms. b Electrical resistivity model from E3, with an absolute error of 6.2%. Annotations include: tie points with other lines as numbered in Fig. 3 (grey, numbered boxes), springs (blue circle), BTS sensors (green diamonds), boundaries between neighbouring talus cones (vertical dashed lines), and areas of concentrated groundwater flow (ellipses with solid black outline). Data gaps in the layer above bedrock (a) are due to limited ray path coverage. The exact geometry of the bedrock surface is somewhat uncertain, as expressed by the two dotted lines (a)

