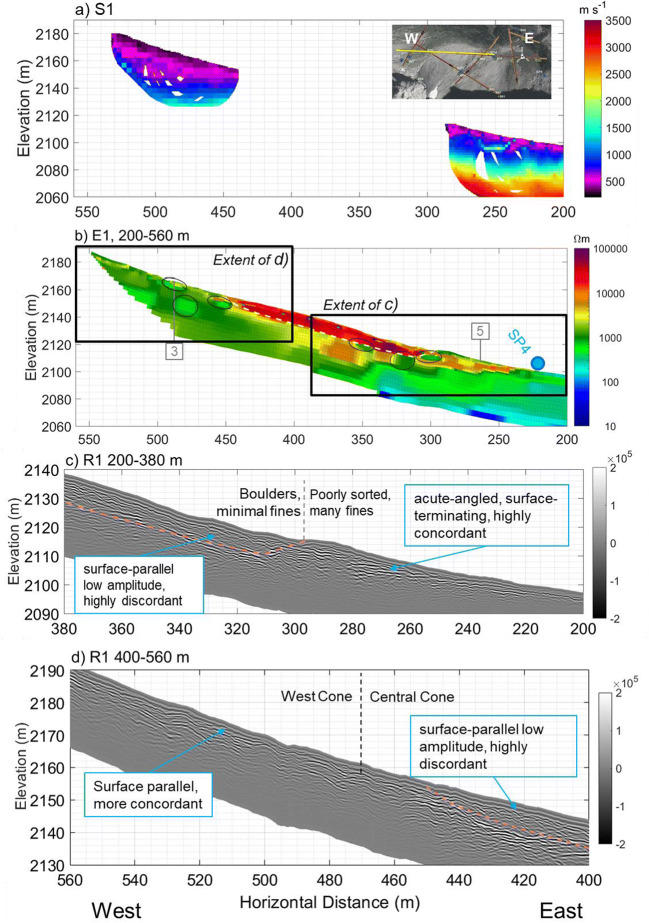
Fig. 7.
a P-wave velocity models (RMS = 1.8 ms) and b resistivity model (absolute error = 4.8%) along the portion of Line 1 crossing talus deposits. Annotations indicate the locations of: springs (blue circle), tie points with other lines as numbered in Fig. 3 (grey, numbered boxes), and convergent flow paths (black ellipses). A sample of GPR data showing the differences in texture near the base of the Central Cone (c) and between the west and Central Cone (d)

