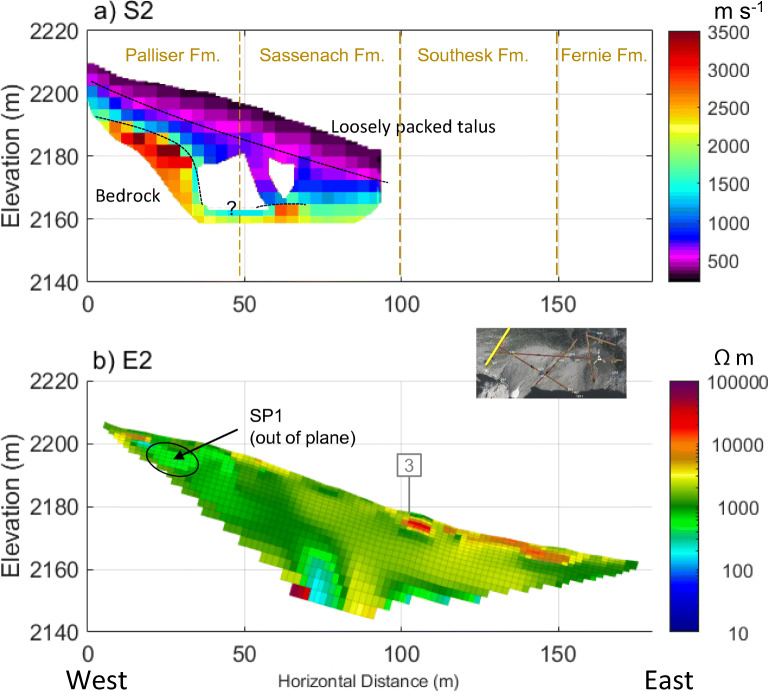
Fig. 8.
Composite of the a P-wave velocity model (RMS = 2.6 ms) and b resistivity model (absolute error = 3.2%) along line 2. Annotations indicate the locations of: tie points with Line 3 at approximately 100 m (grey box with “3”), convergent flow paths (black ellipses), and the locations of inferred geological contacts from McMechan (2012) (dashed tan lines). Data gaps in the layer above bedrock (a) are due to limited ray path coverage

