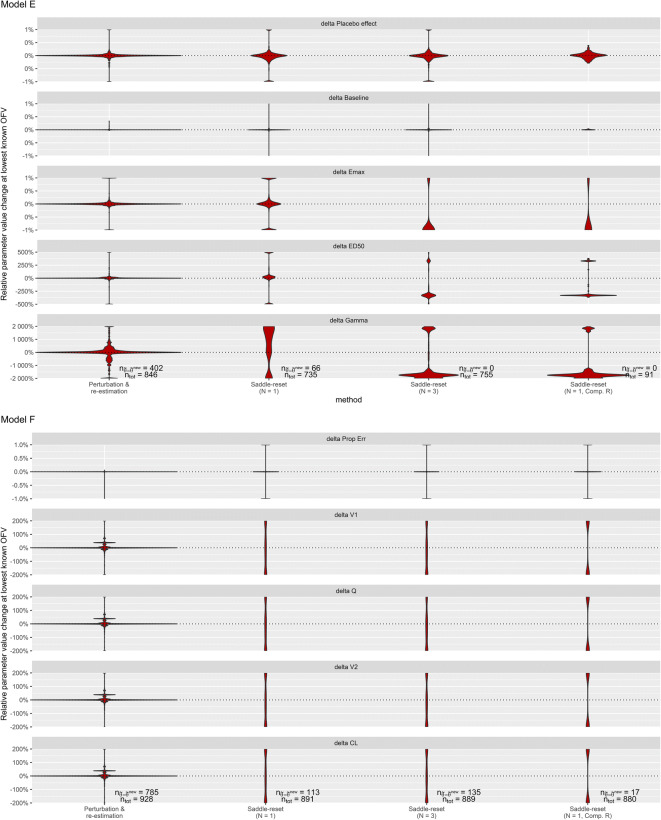
Fig. 4.
Violin plots displaying change in selected fixed effects parameter values between the respective method and default estimation, relative to true values, delta values in percent, for the non-identifiable models E (top) and F (bottom), at their respective lowest − 2log(likelihood). The four methods compared are, in order from the left, perturbation and re-estimation, one saddle-reset step, three saddle-reset steps, and one saddle-reset step with computed R-matrix. A wider distribution and separation from zero indicates better performance in exposing the non-identifiability. Using a computed R-matrix produces parameter values that are vastly different from the default estimation, clearly indicating non-identifiability. Some parameters remain identifiable, such as baseline in model E and proportional error in model F. The total number of estimations that reached the lowest known OFV (ntot), and the number of estimations that produced the same parameter estimates in default estimation and in the respective method (nθ̃=θ̃new), is shown in the bottom panel for each method in each model. A lower ntot indicates that estimations crashed or did not reach the lowest OFV. A lower nθ̃=θ̃new means that more estimations unveiled non-identifiability

