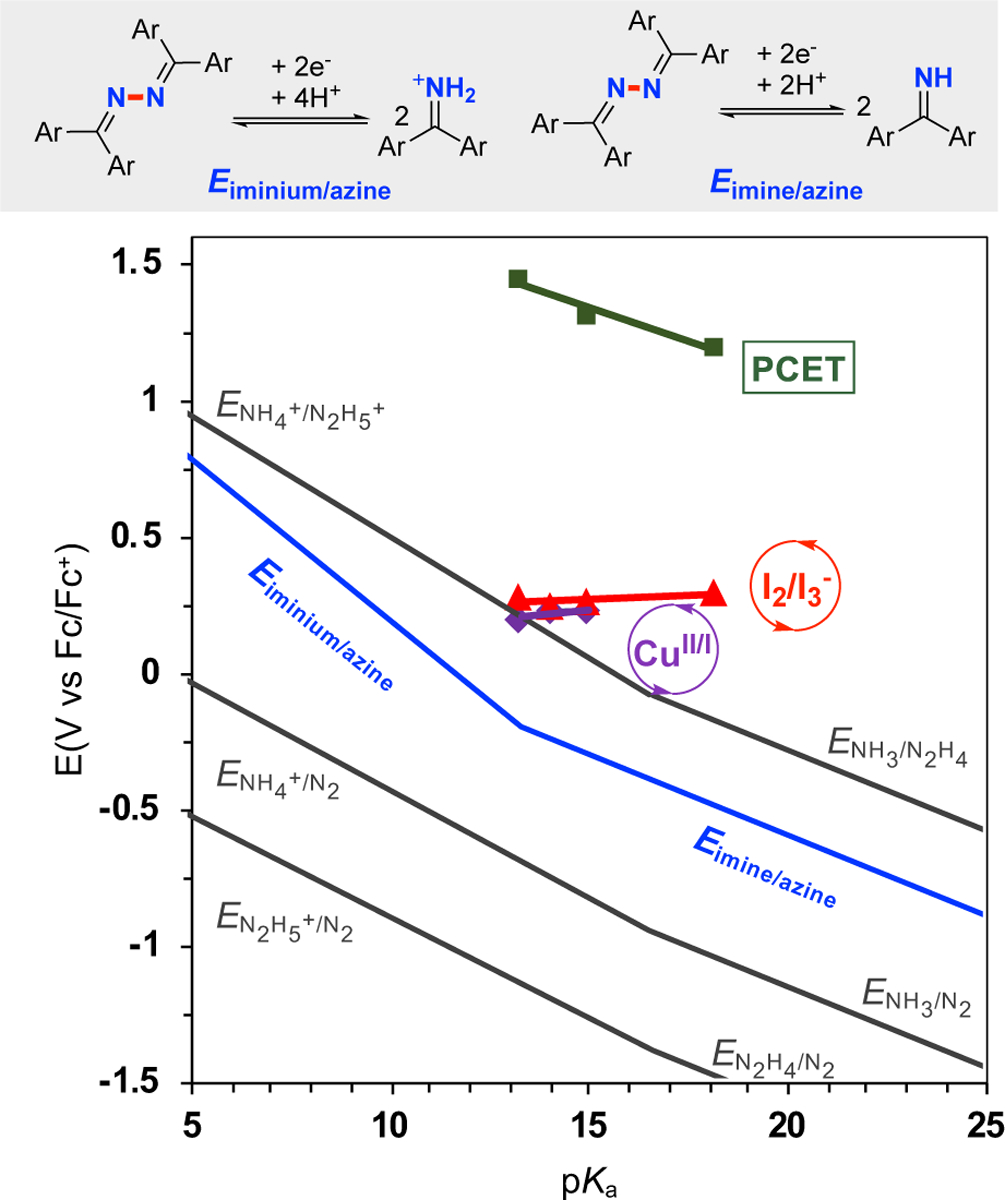
Figure 5. Pourbaix-type diagram for azine (2)/benzophenone imine (1), N2/NH3/N2H4 species, and redox potentials for the three electrochemical processes for azine synthesis.

Potentials for processes (gray lines) involving N2 can be found in ref. 17. The blue line is the thermodynamics of azine 2 and imine 1 equilibrium. Green squares correspond to the PCET potentials with different buffer solutions: 5 mM 1 in CH3CN (10 mL) with nBu4NPF6 (0.1 M). Red triangles correspond to I 2/I3− potentials with different buffer solutions: 5 mM nBu4NI in CH3CN (10 mL) with 50 mM 1 and nBu4NPF6 (0.1 M). Purple diamonds correspond to the relevant CuII/I potentials with different buffer solutions: 5 mM [Cu(CH3CN)4]PF6 in CH3CN (10 mL) with 100 mM 1 and nBu4NPF6 (0.1 M). All the CV studies were performed with glassy carbon as working electrode (~ 7.0 mm2) and a platinum wire (1.0 cm, spiral wire) as counter electrode, scan rate = 20 mV/s.
