
Figure 4.
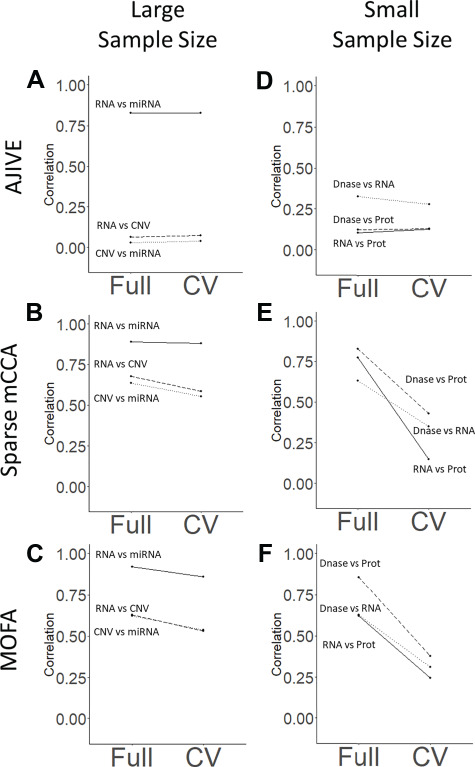
Overfitting plot: Plots of the pair-wise correlations identified in the full and CV contribution plots for each method. The left column (plots A–C) corresponds to the large-sample analysis (n = 558; TCGA breast cancer), while the right column (plots D–F) corresponds to the small-sample size analysis (n = 53; Li, et al. 2016). Rows correspond to AJIVE, sparse mCCA and MOFA, respectively. Flat lines indicate non-overfitting methods, while lines with a negative slope indicate a large change in the results for the full and CV plots.