
Figure 5.
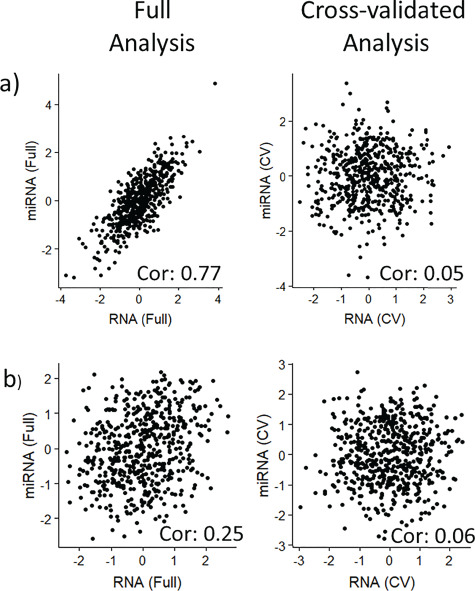
Side-By-Side contribution plots for a) PC-CCA with 100 PCs and b) Sparse mCCA with the null dataset: Left panels show the contribution plots from the full analysis, while right panels show the contribution plots for the CV analysis. Pair-wise correlations are reported on the figure.