Figure 3.

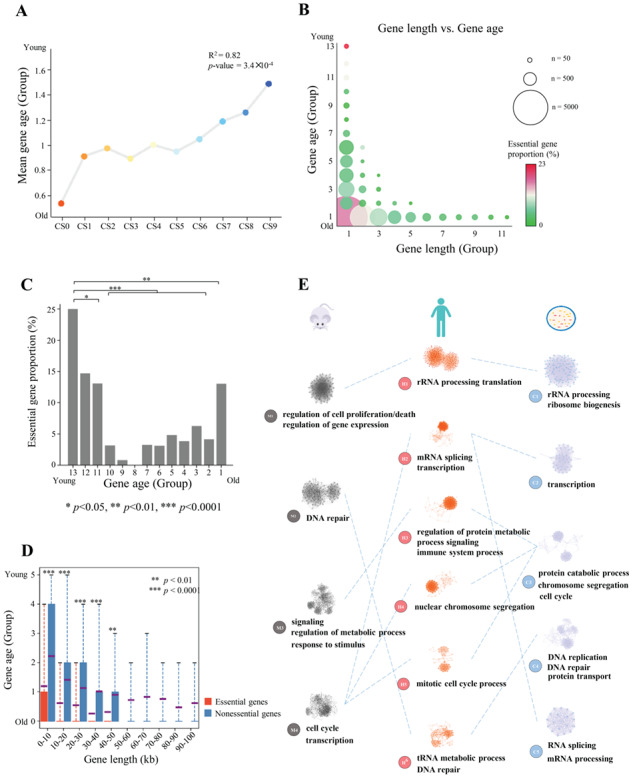
Evolutionary nature of human essential genes. (A) Relationship between gene essentiality and gene age. R2 and P-values from linear regression are shown. (B) Scatterplot of gene length and evolutionary age. Circle size indicates the number of genes, and color represents the essential gene proportion. (C) Essential gene proportions in all 13 gene age groups. (D) Analysis of age differences between essential and nonessential genes grouped by gene length. Red boxes, age data for essential genes. Blue boxes, age data for nonessential genes. Violet line, mean value. Gene groups containing <100 genes are not shown. (E) Essential gene-associated specific functional modules. The network of specific functional interactions among the 1878 human essential genes was clustered using a graph theory clustering algorithm to elucidate gene modules. Six clusters that containing ≥40 genes (H1–H6) were tested for functional enrichment by using genes annotated with GO biological process terms. Representative processes and pathways enriched within each cluster are presented alongside the cluster label. Enriched functions provide a landscape of the potential effects of cellular functions for essential genes. Similar functional processes were shared by essential genes in mouse (four subnet modules) and S. cerevisiae (five subnet modules).
