
Figure 3.
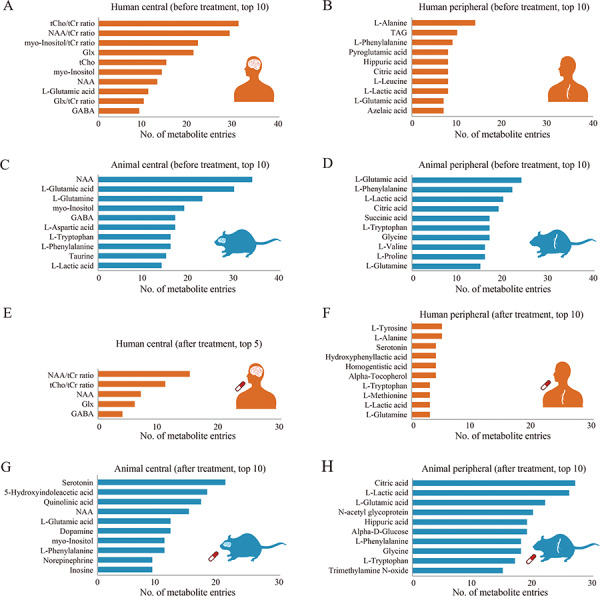
The numbers of entries for the most frequently reported metabolites in separate settings. The plots summarize the numbers of entries for the most frequently reported metabolites in the central (A) and peripheral (B) systems of patients, in the central (C) and peripheral (D) systems of animal models before treatment, and in the central (E) and peripheral (F) systems of patients, and the central (G) and peripheral (H) systems of animal models, after treatment. Orange and blue bars denote the numbers of metabolite entries from human and animal models for the specific metabolites, respectively. GABA, gamma-aminobutyric acid; Glx, glutamate and glutamine; NAA, N-acetyl-L-aspartic acid; tCho, choline-containing compounds; tCr, creatine and phosphocreatine.