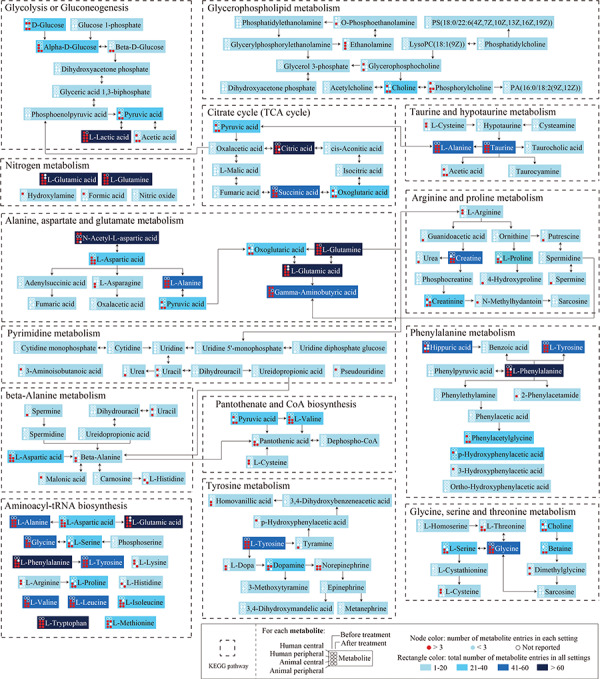
Figure 5.

Metabolites and interactions in the 14 significantly altered metabolic pathways. Dotted boxes represent the significantly altered KEGG pathways (metabolic pathway analysis FDR < 0.05). Rectangles represent the metabolites in the pathways. For each metabolite, nodes in each row represent the number of metabolite entries in the human central, human peripheral, animal central and animal peripheral systems, respectively; nodes in the first and second columns represent the numbers of metabolite entries before and after treatment, respectively. Red node: number of metabolite entries ≥3; blue node: number of metabolite entries <3; hollow node: number of metabolite entries = 0. Colored rectangles represent the total number of metabolite entries across all eight settings, with darker colors representing larger numbers.
