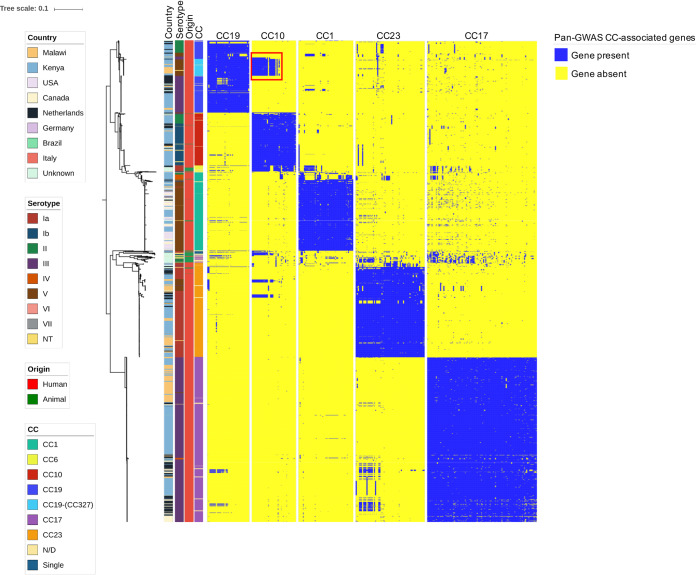
FIG 2.
Core genome-based population structure of GBS. The phylogenetic tree is annotated with 4 colored strips representing the clonal complex, the country of isolation, the origin, and the serotype of each strain. The three binary heatmaps represent the presence (blue) or absence (yellow) of the genes identified by the pan-GWAS pipeline. The tree is rooted at midpoint. The reference strain used in this analysis was COH1, reference HG939456. The red square in the CC10 heatmap highlights the cluster of CC10-associated genes found in CC19 clones. Trees built with different reference strains are shown in Fig. S1 in the supplemental material and show analogous topology.

