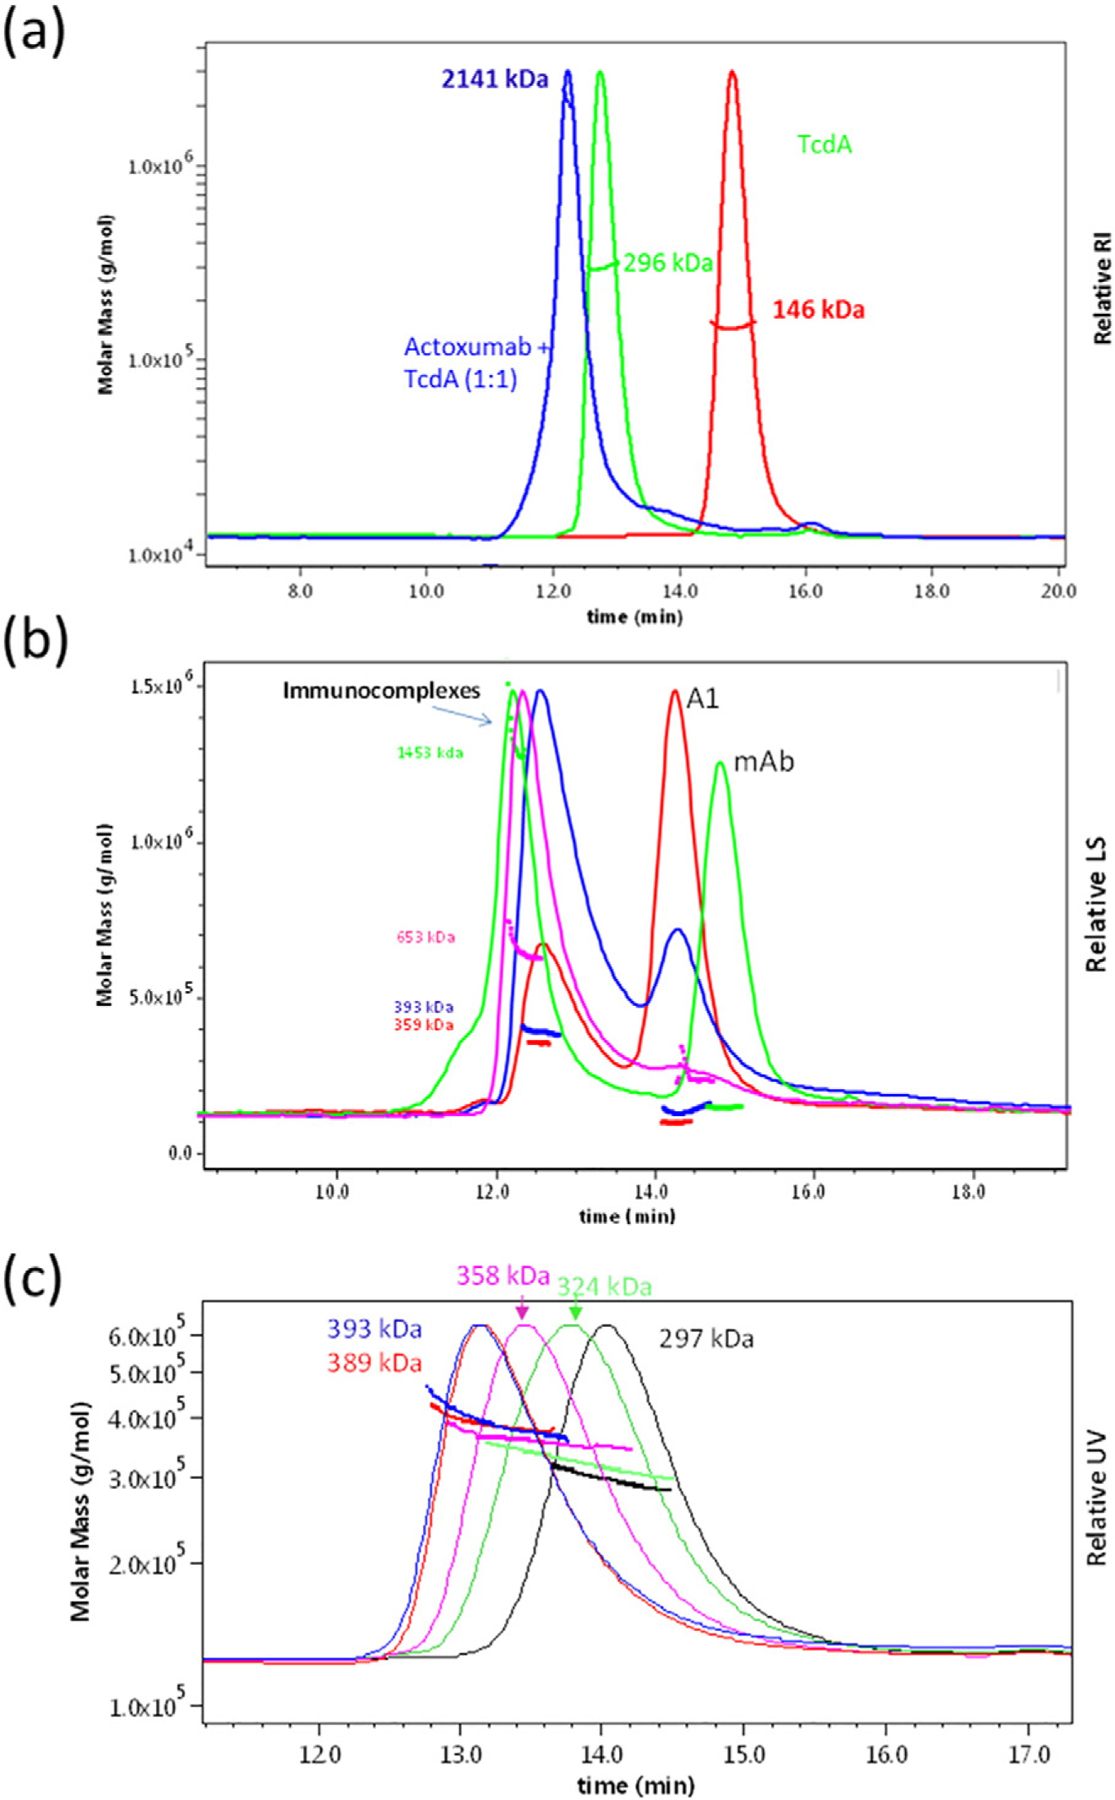
Fig. 3.

SEC-MALLS analysis of actoxumab/TcdA immunocomplexes. Light scattering and molecular mass distributions of immunocomplexes formed at various antibody:antigen molar ratios as a function of elution time. (a) Chromatograms of TcdA (green), actoxumab (red), and of actoxumab/TcdA immunocomplexes formed at 1:1 actoxumab:TcdA molar ratio (blue). (b) Chromatograms of actoxumab/A1 immunocomplexes formed at 1:5 (red), 1:1 (blue), 2:1 (pink), and 5:1 (green) actoxumab:A1 molar ratios. (c) Chromatograms of actoxumab-Fab alone (red) and of actoxumab-Fab/TcdA immunocomplexes formed at 1:5 (green), 1:1 (pink), 5:1 (dark red), and 10:1 (blue) Fab:TcdA molar ratios.
