
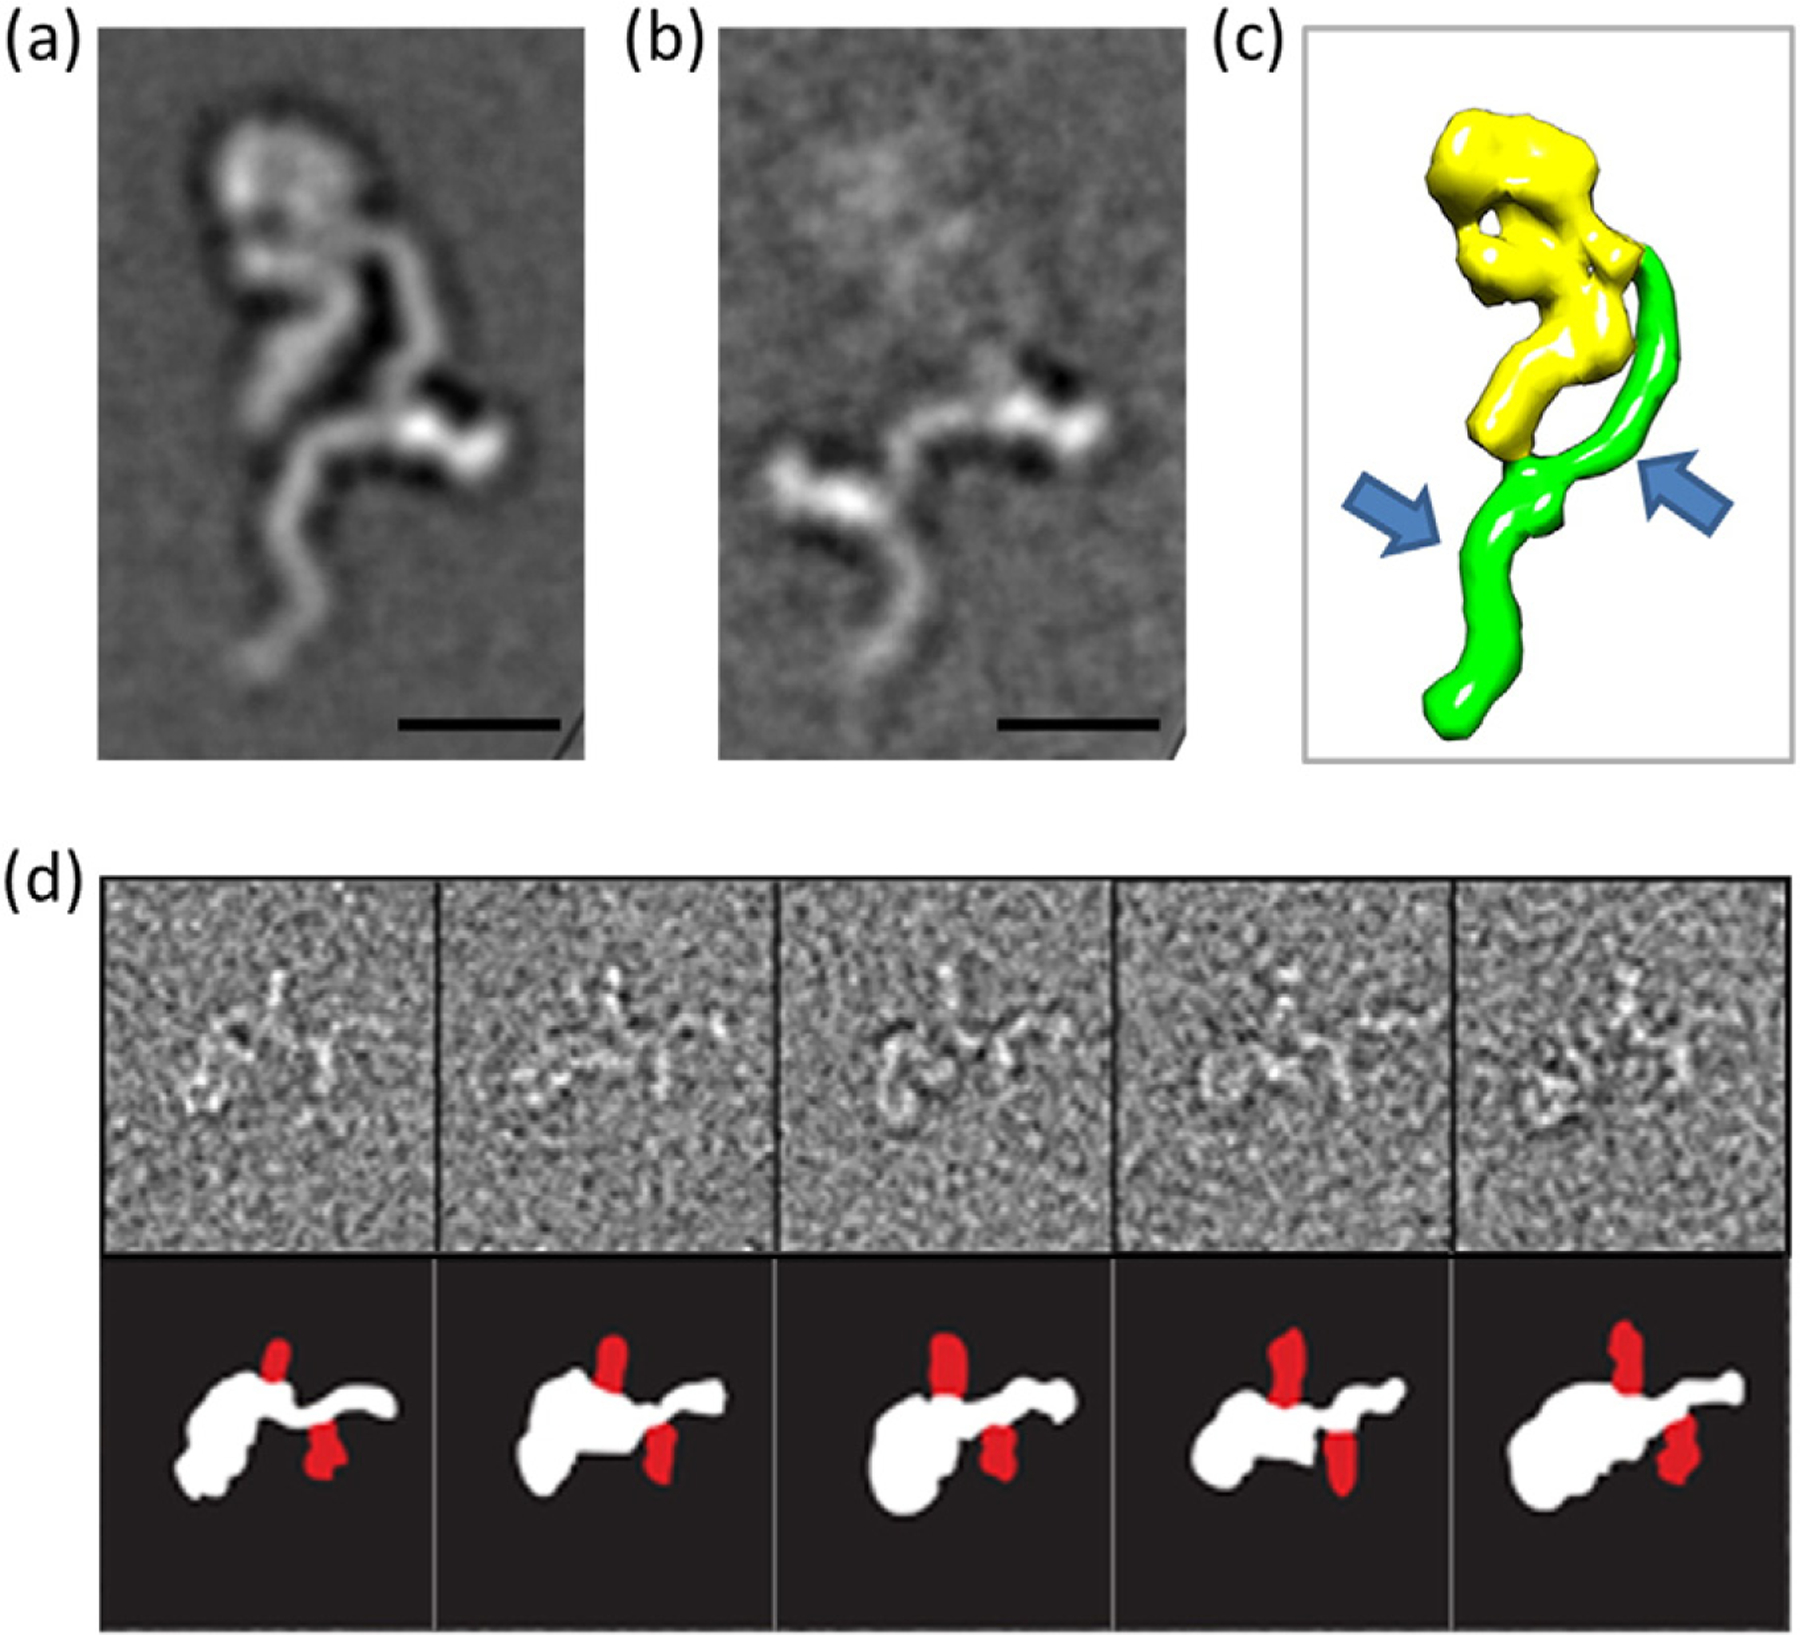
Fig. 4.
Negative-stain EM images of actoxumab-Fab bound to TcdA. Representative class averages of actoxumab-Fab bound to TcdA holotoxin (6996 total particles, in dataset). (a) Individual classes for a single-site Fab (204 particles) or (b) two-site Fabs (40 particles) bound to the TcdA CROP domain at Fab:toxin ratio of 3:1. Side length of each panel is 52.7 nm (scale bar represents 10 nm). (c) Schematic representation of TcdA with arrows showing regions where Fab fragments bind (model based on EM data from Ref. [33]). (d) Gallery of selected particles from the two-site class (top), with schematic (below) outlining individual components (TcdA white, Fab red).