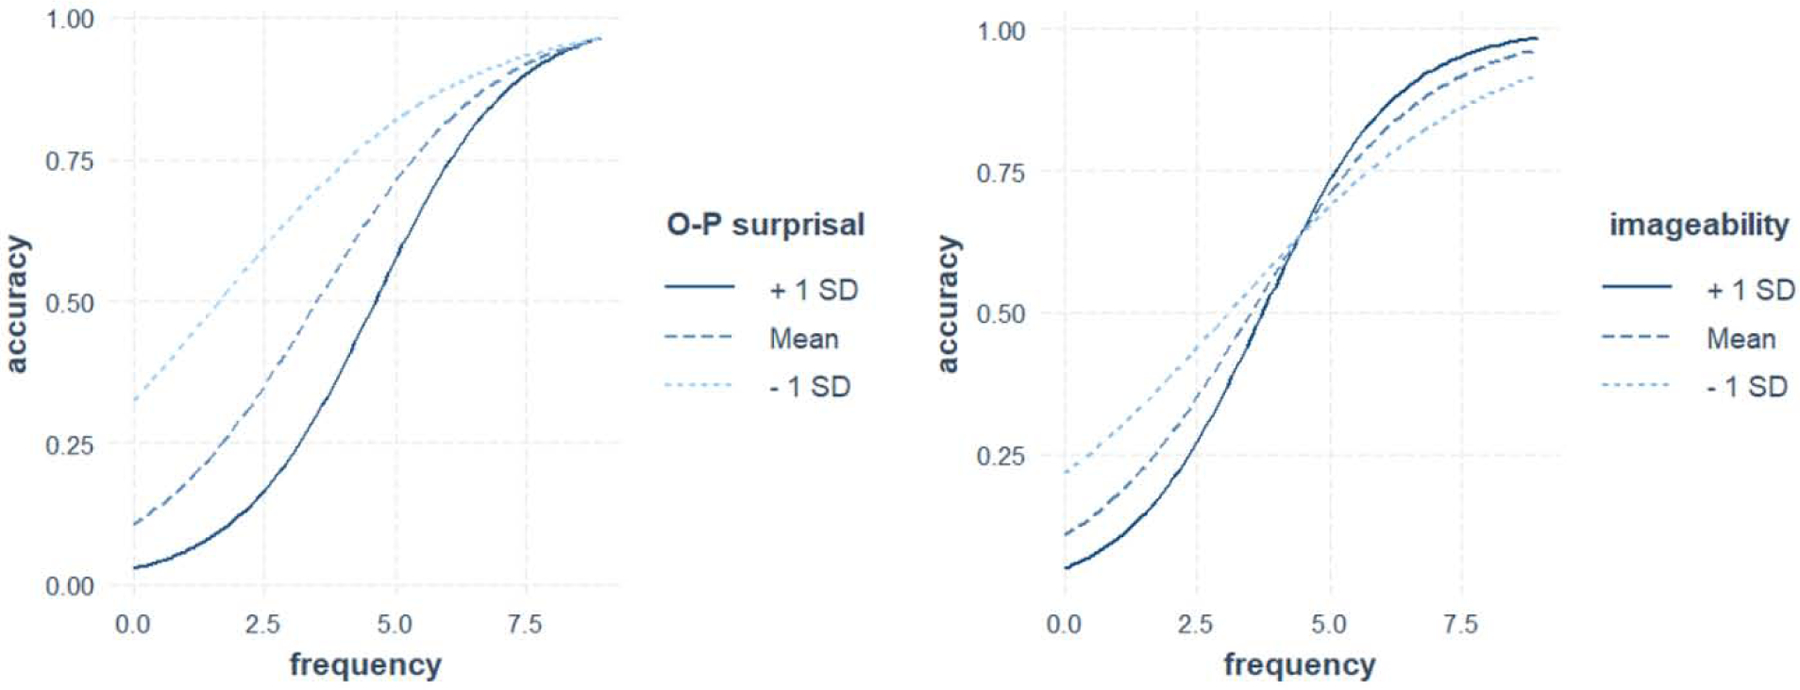
Figure 1.

Significant interactions in the group-level analysis of Study 1. Left panel: greater impact of frequency in higher levels of surprisal (i.e. when O-P regularities are less consistent). Right panel: greater impact of frequency in higher levels of imageability. Plots created using the interact_plot() function in interactions package in R (Long, 2019).
