
Figure 4.
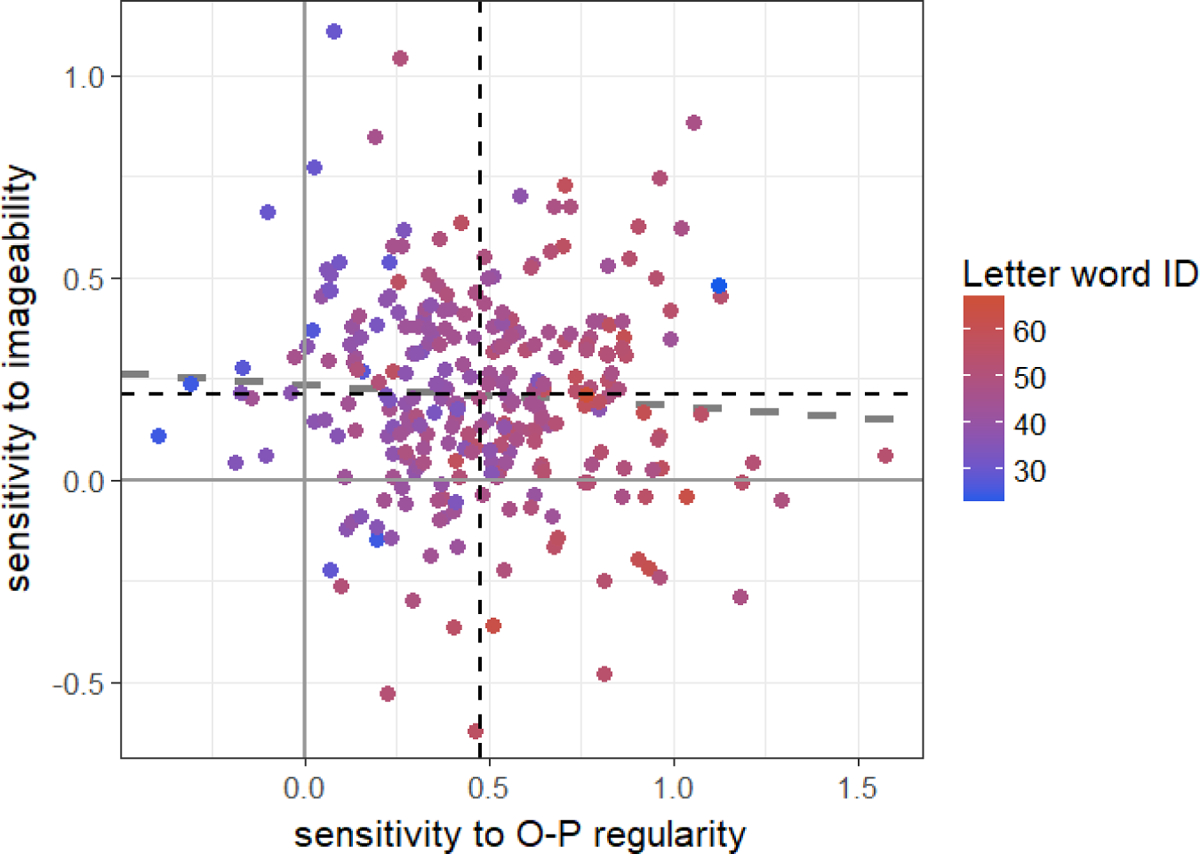
Variability among participants in Study 2 in sensitivity to imageability (y-axis) and O-P regularities (x-axis). Vertical and horizontal dashed lines show mean sensitivity to O-P regularity and imageability, respectively. Dashed trend line show correlation between the two slope measures. Color scale presents raw score on Letter-Word Identification task.