. 2018 Dec 3;2(4):NS20180132. doi: 10.1042/NS20180132

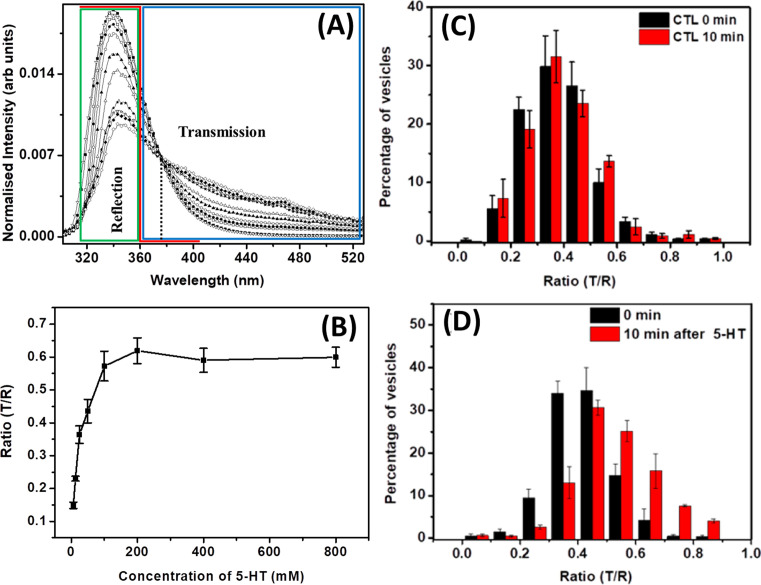
Figure 3. (A) Area-normalized fluorescence emission spectra of serotonin at different concentrations (at 60 µM, 1, 12.5, 25, 50, 100, 200, 300, 400, 500, and 600 mM, respectively). The iso-emissive point at 376 nm is shown with a dotted vertical line. Solid red line schematically shows the spectral characteristic of the UV dichroic (360 nm long pass). (B) Three-photon fluorescence intensity ratio of transmission (T) and reflection (R) obtained from serotonin solutions as a function of concentration. The reflected signal is collected from the region indicated by the green box in (A), while the transmitted signal is collected from the region indicated by the blue box in (A). (C) Histogram of the mean ratios of signals collected in the transmission and reflection channels (T/R) at 0 and 10 min after vehicle treatment. (D) Histogram of the mean T/R ratio after 0 and 10 min after treatment with externally added serotonin solution (400 μM) (error bar = S.E.M.). (A) Reprinted from Nag S., Balaji J., Madhu P.K. and Maiti, S. (2008) Intermolecular association provides specific optical and NMR signatures for serotonin at intravesicular concentrations. Biophys. J., 94, 4145–4153, copyright (2008) with permission from Elsevier. (B–D) Reprinted with permission from Das, A.K.; Maity, B.K.; Surendran, D.; Tripathy, U.; Maiti, S. (2017) Label-free ratiometric imaging of serotonin in live cells. ACS Chem. Neurosci., 8(11), 2369–2373 [71]. Copyright (2017) American Chemical Society.

Figure 3