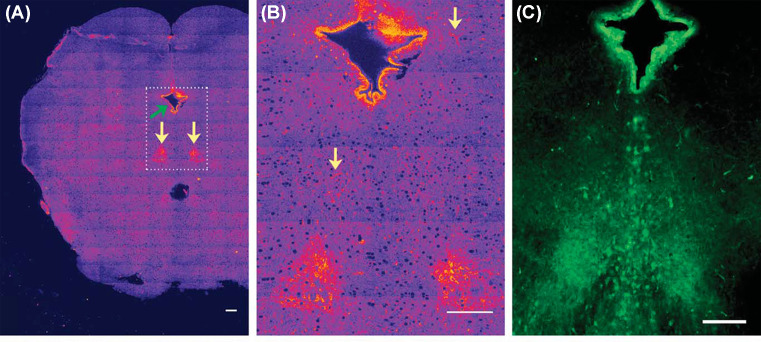
Figure 4. Mapping serotonin distribution in live rat brain slice.
(A) Three-photon excited serotonin distribution in a brain slice containing the raphe nuclei (marked by yellow arrow). The image is made by stitching 160 high-resolution images. (B) Zoomed up view of the rectangular region [dashed lines in (A)] containing the raphe and the ependymal region. Arrows here mark some non-raphe regions. (C) Epifluorescence image of serotonin immunofluorescence in a similar region of a brain slice (Reprinted with permission from Kaushalya, S.K.; Nag, S.; Ghosh, H.; Arumugam, S.; Maiti, S., (2008) A high-resolution large area serotonin map of a live rat brain section. Neuroreport, 19, 717–721 [50]). Copyright(2008) Wolters Kluwer Health, Inc.

