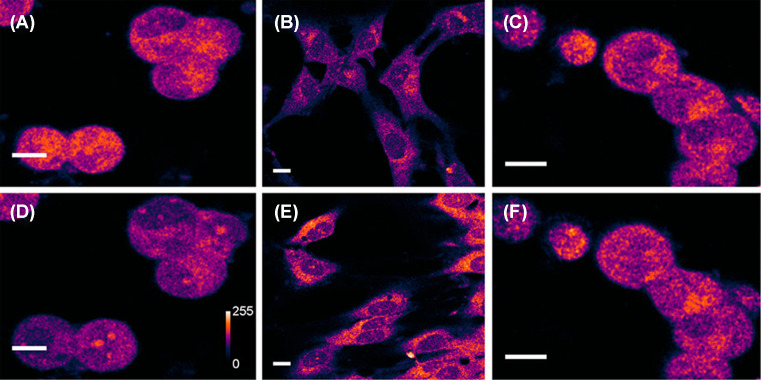
Figure 7. Two-photon auto-fluorescence of dopamine in dopaminergic MN9D cells and in glia.
(A,D) Collection of MN9D cells before (A) and 15 min after (D) treatment with 100 μM of PCA. The signal intensity decreases by 34 ± 5%. Vehicle-treated control cells are shown under identical imaging conditions in (C) (before) and (F) (after). The control cells show 1 ± 3% increase in the same period. (B,E) Glia treated with vehicle (B) and 10 mM dopamine for 4 h (E). Fluorescence intensities are false color coded. For (B,E), the brightness is 3× enhanced. Scale bar = 10 μm. (Reprinted with permission from Sarkar, B.; Banerjee, A.; Das, A.K.; Nag, S.; Kaushalya, S.K.; Tripathy, U.; Shameem, M.; Shukla, S.; Maiti, S. (2014) Label-free dopamine imaging in live rat brain slices. ACS Chem. Neurosci., 5(5), 329–334 [49]). Copyright (2014) American Chemical Society.)

