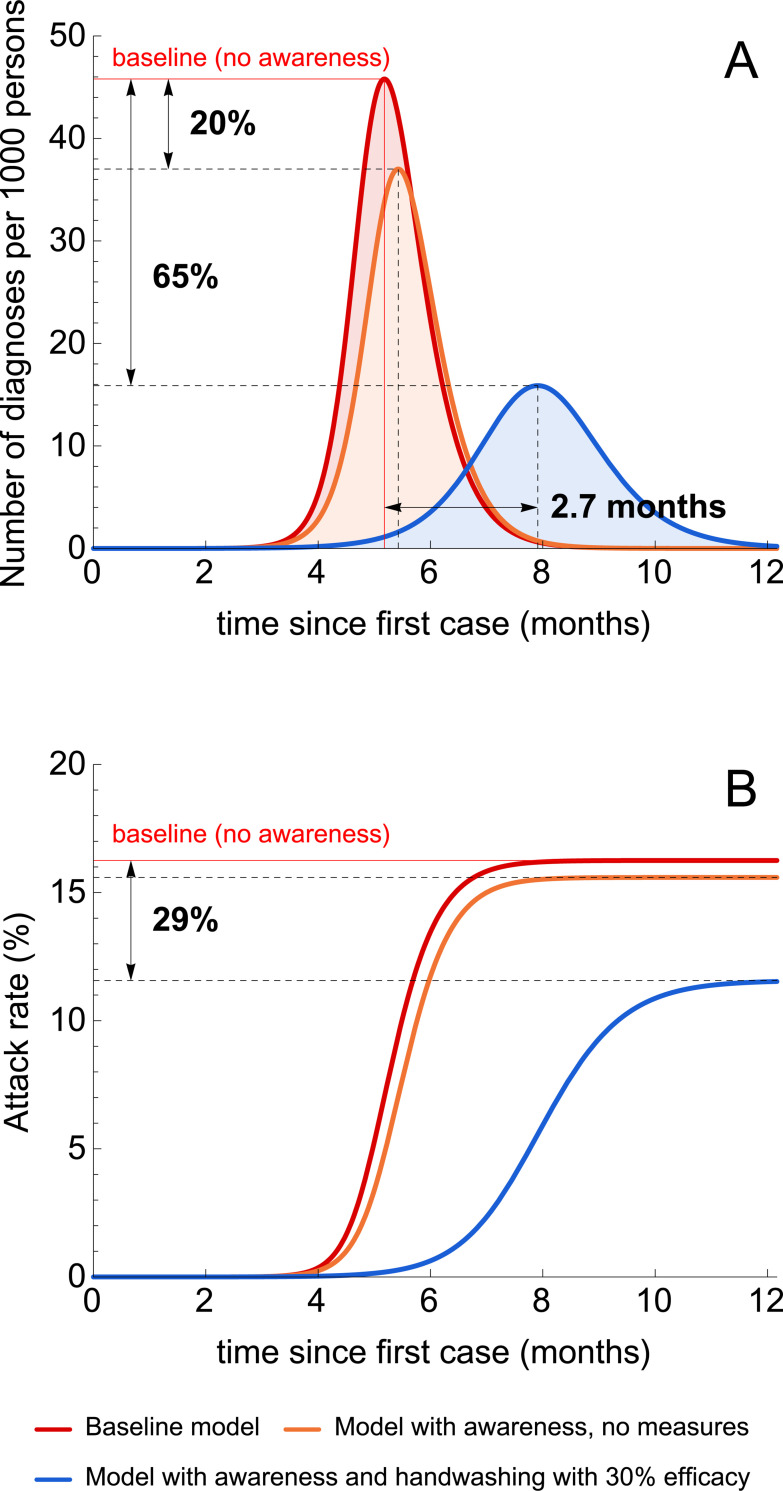
Fig 3. Illustrative simulations of the transmission model.
(A, B) Shows the number of diagnoses and the attack rate during the first 12 months after the first case under three model scenarios. The red lines correspond to the baseline transmission model. The orange lines correspond to the model with a fast rate of awareness spread and no interventions. The blue lines correspond to the latter model, where disease awareness induces the uptake of handwashing with an efficacy of 30%.

