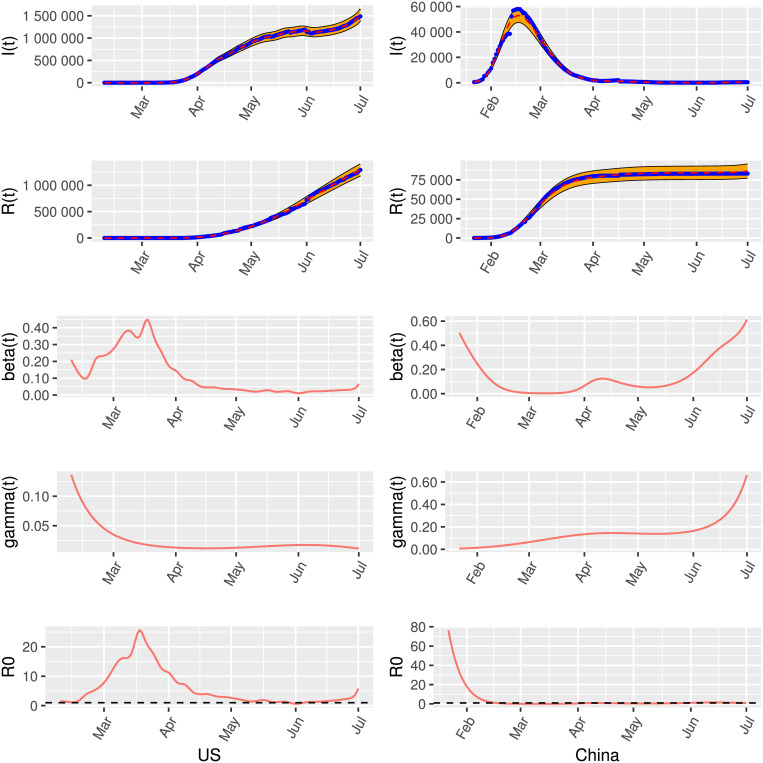
Fig 2. Estimated reproduction number for selected countries based on the data up to June 30, 2020.
The US (left) and China (right) are shown based on the data up to June 30, 2020. The blue dots and the red dashed curves represent the observed data and the model-based predictions, respectively, with 95% confidence interval.

