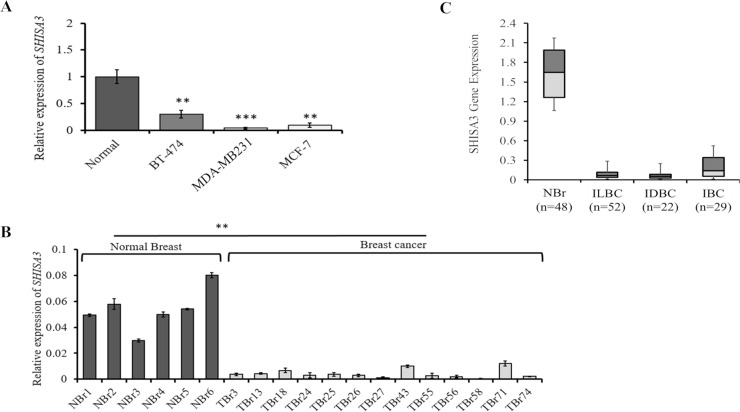
Fig 1. Expression analysis of SHISA3 in breast cancer.
The mRNA levels of SHISA3 were quantified by qPCR and in silico analysis. A) The figure shows relative expression of the SHISA3 in the normal cells and breast cancer cell lines. B) The bar graphs show the relative expression of the SHISA3 genes in the normal breast (NBr) and tumor (TBr) tissues. C) In silico analysis of SHISA3 expression levels in normal and various breast cancer subtypes. IBC: Invasive Basal Carcinoma, ILBC: Invasive Lobular Carcinoma, IDBC: Invasive Ductal Carcinoma and NBr: normal breast tissues.

