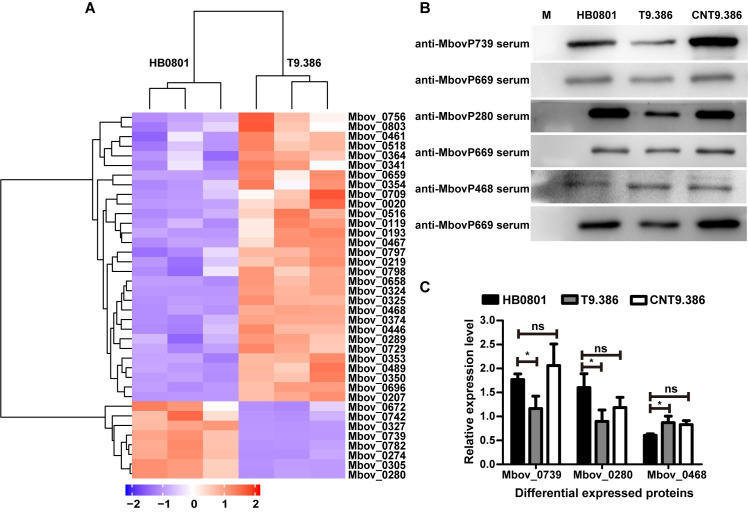
Fig 6. Differential expression profiles of M. bovis HB0801 and mutant T9.386 based on whole-cell proteomics.
(A) A heatmap showing the 38 proteins with a significant difference in expression (difference ≥ 2-folds; p < 0.05) between the parental (HB0801) and the T9.386 (T9.386) strains. Each row represents one protein designated by corresponding CDS in M. bovis HB0801. Each column represents one sample (three replicates per strain). The dendrogram at the top of the figure clusters samples based on similarity in protein expression patterns. The dendrogram at the left of the figure shows relationships in proteins based on expression profiling. Red color represents a higher relative protein abundance compared with the mean, while blue illustrates a relative abundance below the mean. (B) Western blot analysis of Mbov_0280, Mbov_0468 and Mbov_0739 expression in M. bovis parental strain (HB0801), mutant T9.386 (T9.386) and mutant T9.386 transformed with plasmid pCN-T9.386 (CNT9.386). Mbov_0669 was used as control. Anti-sera raised against individual M. bovis recombinant proteins were used as primary antibodies (1:500). (C) The relative expression level of Mbov_0280, Mbov_0468, and Mbov_0739. Values were normalized using Mbov_0669. The data are presented as the means of three independent assays. Standard deviations are indicated by error bars. p values are indicated by asterisks (*p < 0.05, ns = p > 0.05).

