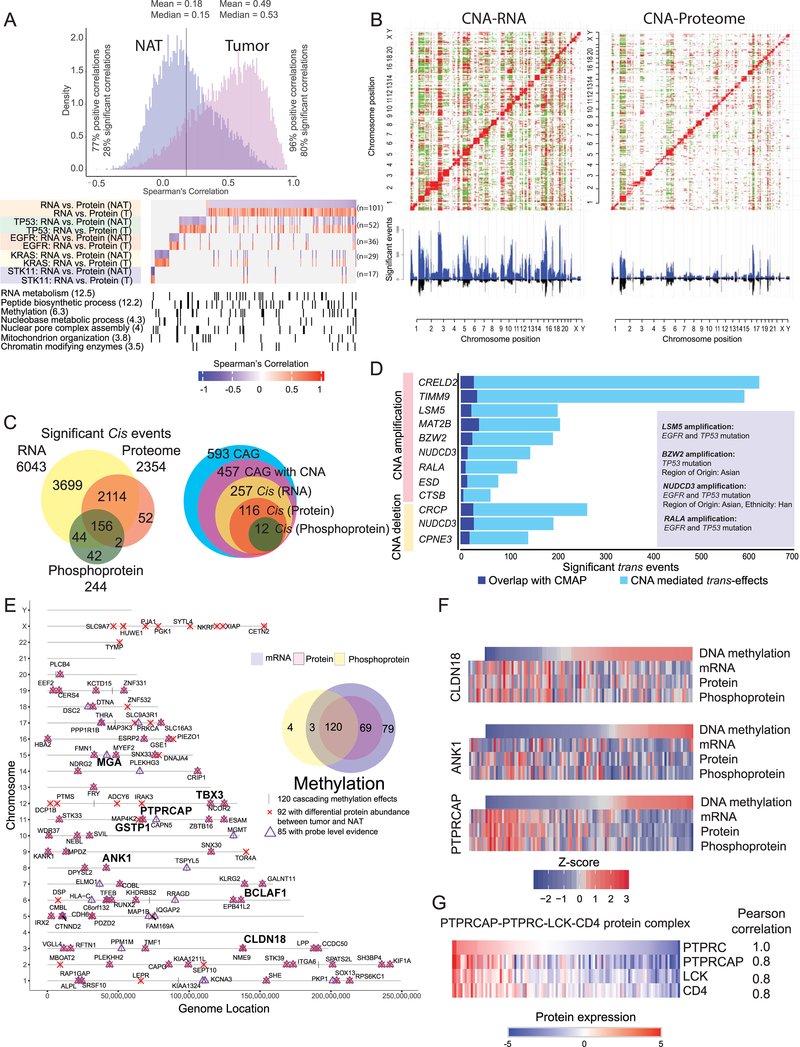
Figure 3: Impact of copy number alteration (CNA) and DNA methylation on protein and phosphoprotein expression.
(A) Correlation between steady-state mRNA and protein abundances in tumors and NATs (n=101 pairs) for genes with discrepant tumor/normal mRNA-protein correlations. Bottom panel represents enriched biological terms, with -Log10 (p-value) in brackets.
(B) Correlation plots between CNA and RNA expression and between CNA and protein abundance. Significant (FDR <0.05) positive and negative correlations are indicated in red and green, respectively. CNA-driven cis-effects appear as the red diagonal line; trans-effects appear as vertical red and green lines. The accompanying histograms show the number of significant (FDR <0.05) cis- and trans-events corresponding to the indicated genomic loci (upward plot) as well as the overlap between CNA-RNA and CNA-protein events (downward plot).
(C) Venn diagrams depicting the cascading effects of CNAs. The Venn diagram on the left shows the overlap between significant cis-events across the transcriptome, proteome and phosphoproteome. The Venn diagram on the right shows the same analysis restricted to cancer-associated genes (CAG) with significant cis-effects across multiple data types.
(D) Genes with CNA events that show significant similarity (BH FDR <0.1) between their significant trans-effects (FDR <0.05) and the Connectivity Map (CMAP) genomic perturbation profiles. Inset shows significant enrichment (Fisher’s exact test, FDR <0.1) for specific mutational or demographic features for 4 genes.
(E) Genes whose DNA methylation was associated with cascading cis-regulation of their cognate mRNA expression, global protein level and phosphopeptide abundance. Bold type highlights a few known cancer genes.
(F) Methylation-driven cis-regulation of selected genes (n = 109 samples). Gene-level methylation scores, RNA expression levels and protein/phosphopeptide abundances were converted into Z-scores and the tumor samples were ordered by methylation levels.
(G) Coordinated expression of proteins associated with PTPRC (CD45) complex in tumors.

