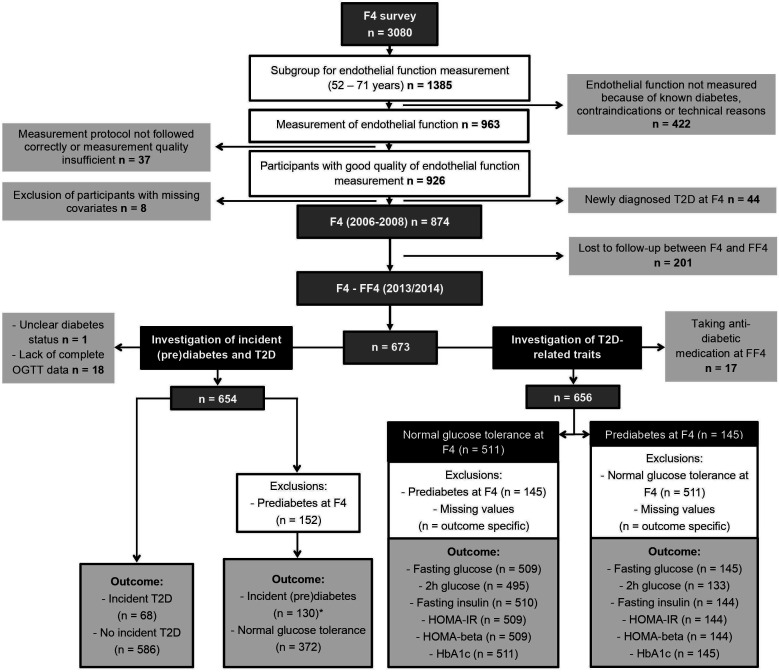
Figure 1.
Flow chart of study participants and exclusions. *Including 111 participants with prediabetes at FF4 and 19 participants with type 2 diabetes at FF4. HbA1c, hemoglobin A1c; HOMA-beta, homeostasis model assessment of beta-cell function; HOMA-IR, homeostasis model assessment of insulin resistance; OGTT, oral glucose tolerance test; T2D, type 2 diabetes.

