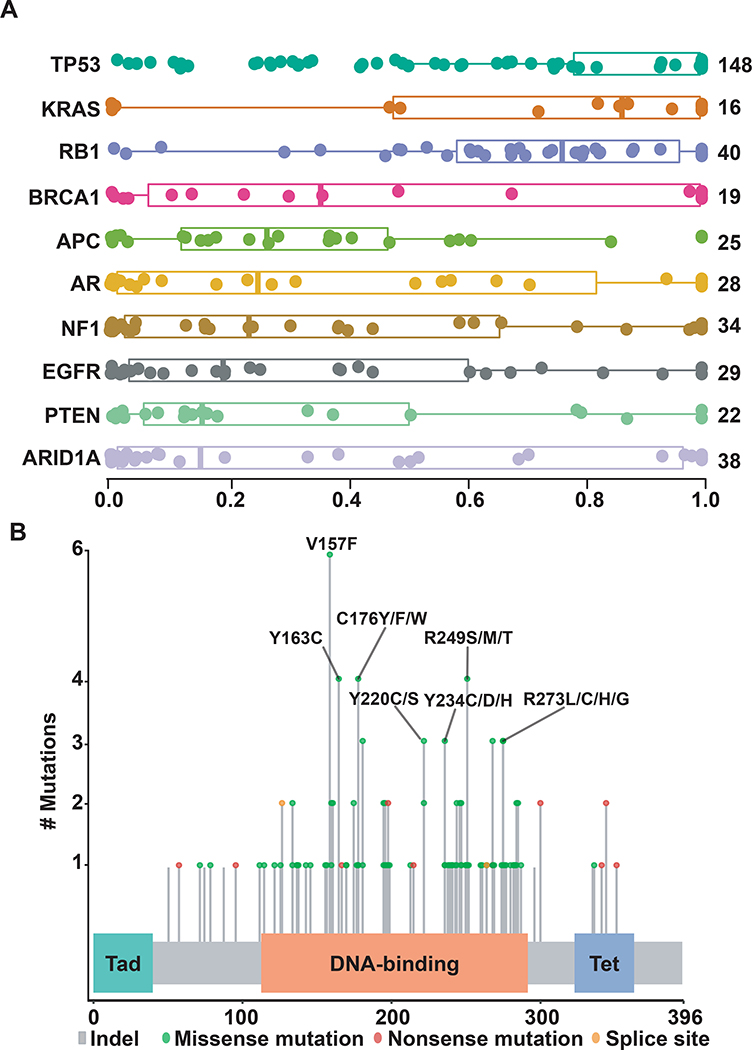
Figure 5. Distribution plots for ctDNA clonality and TP53 mutations across SCLC samples.
Panel A shows distribution of inferred AFs for non-synonymous mutations in different genes across relapse samples, with inferred AF values shown on X-axis. Genes near the top of the Y-axis with higher inferred AF values are likely to represent clonal alterations, while genes below them are more likely to be sub-clonal. Boxes represent interquartile range around the median. Panel B demonstrates pattern of mutations in TP53 that were shed at highest allelic frequency in each individual sample. Tad = Transactivating domain. Tet = Tetrameriization domain.

