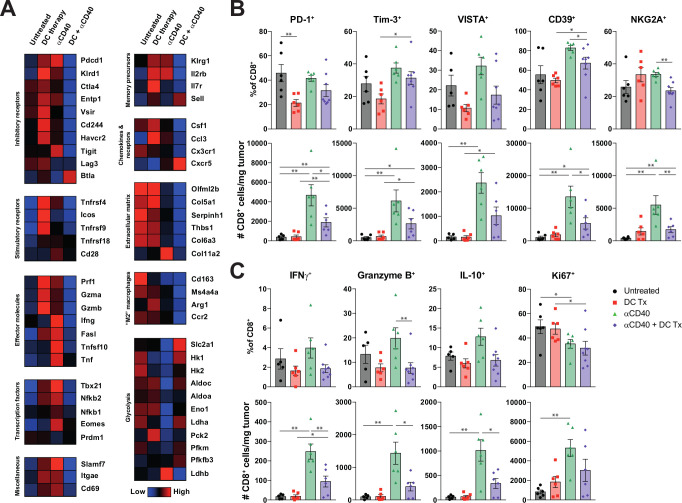
Figure 6.
DC vaccination is able to reduce hallmarks of T-cell exhaustion. (A) Heatmap illustrating the average transcript expression of the indicated genes, grouped by function. Rows represent averaged z-scores. (B) Number and percentage of PD-1+, Tim-3+, VISTA+, CD39+ and NKG2A+ subsets of CD8 +TILs. (C) Number and percentage of IFNγ+, granzyme B+, IL-10+ and Ki67+ subsets of CD8 +TILs. n=7–8 per group. Significance was determined using the non-parametric Mann-Whitney U test. Data presented as the mean±SEM. *P<0.05, **P<0.01 DC, dendritic cell; IFNγ, interferon-γ; TILs, tumor infiltrating lymphocytes.

