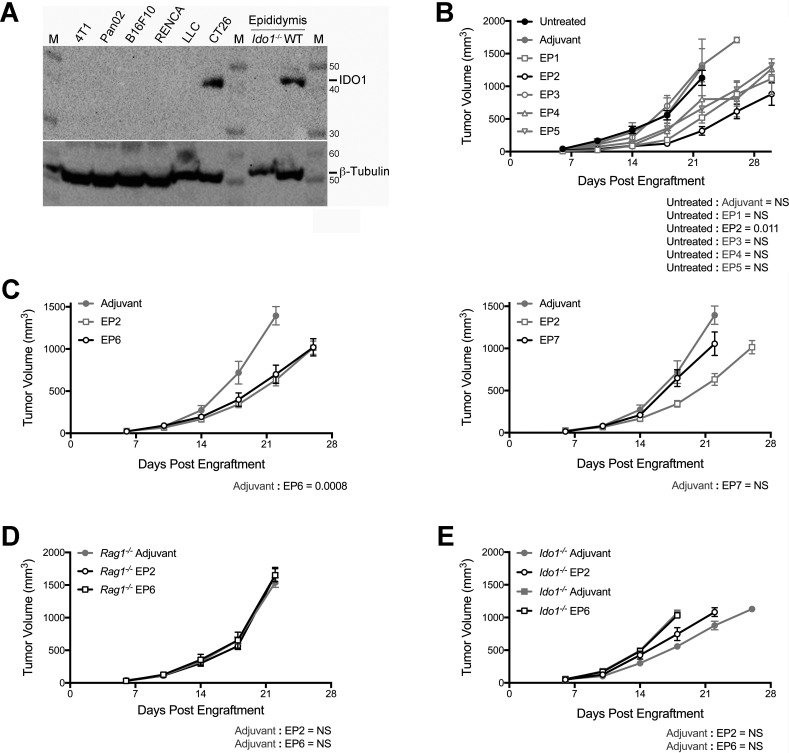
Figure 1.
Growth delay of indoleamine 2,3-dioxygenase 1 (IDO1)-positive CT26 tumors by prophylactic vaccination with major histocompatibility complex (MHC) class I-directed or II-directed IDO1 peptides requires intact adaptive immunity and host IDO1. (A) Western blot analysis of tumors formed by six different mouse tumor-derived cell lines for comparison of IDO1 protein levels (top panel) with β-tubulin as a loading control (bottom panel). Epididymis lysates from wild-type (WT) and Ido1-/- male BALB/c strain mice were included as positive and negative controls. M designates the molecular weight marker. (B) Growth curves of CT26 tumors in mice administered single doses of five different MHC class I-directed, IDO1 peptide vaccines (EP1–5) 7 days prior to tumor engraftment. Overall responses are plotted as means±SEM together with concurrent results from both untreated and vehicle-treated animals. Growth curves for all groups are represented with gray lines except for the treatment cohort exhibiting the strongest response (EP2) and the untreated cohort which are distinguished with black lines. (n=6 tumors/cohort). (C) Growth curves of CT26 tumors in mice treated with two different MHC class II-directed, IDO1 peptide vaccines (EP6 left, EP7 right) 7 days prior to tumor engraftment. Overall responses (black lines) are plotted as means±SEM. Concurrent results from both vehicle and EP2 peptide-treated animals (gray lines) are included on each graph for comparison (n=10 tumors/cohort). (D) Growth curves of CT26 tumors in Rag1–/– mice vaccinated with the MHC class I-directed and II-directed IDO1 peptides EP2 and EP6 7 days prior to tumor engraftment. Overall responses (black lines) are plotted as means±SEM. Concurrent results from vehicle-treated animals (gray lines) are included on each graph for comparison (n≥6 tumors/cohort). (E) Growth curves of CT26 tumors in Ido1-/- mice vaccinated with EP2 and EP6 7 days prior to tumor engraftment. Overall responses (black lines) are plotted as means±SEM. Concurrent results from vehicle-treated animals (gray lines) are included on each graph for comparison (n=10 tumors/cohort). P values from longitudinal analysis of tumor growth for each peptide vaccine-treated group compared with untreated or vehicle-treated animals are included on each graph.

