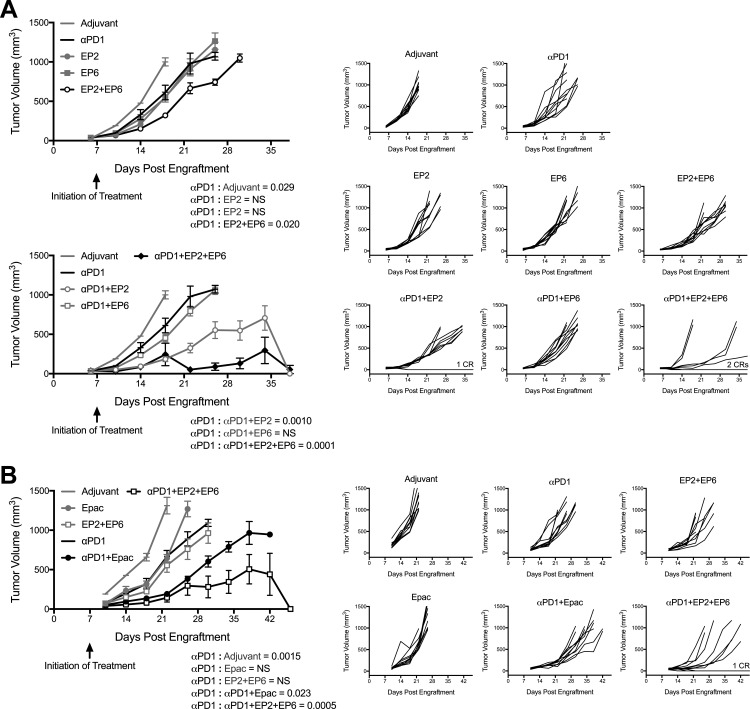
Figure 4.
Programmed cell death protein 1-binding antibody (anti-PD1 antibody) cooperativity with major histocompatibility complex (MHC) class I-directed and II-directed indoleamine 2,3-dioxygenase 1 (IDO1) peptides compared with epacadostat. (A) Growth curves of CT26 tumors in wild-type (WT) mice receiving the MHC class I-directed and II-directed peptides EP2 and EP6 either separately or together with or without the anti-PD1 antibody beginning 7 days after tumor engraftment. The experiment is divided between two graphs for clarity. (top left) Responses to adjuvant alone, individual peptides or anti-PD1 alone (gray lines), and the combined peptides (black lines), are plotted as means±SEM (n=10 tumors/cohort). (bottom left) Responses to adjuvant alone, anti-PD1 alone or with the individual peptides (gray lines), and anti-PD1 with the combined peptides (black lines) are plotted as means±SEM (n=10 tumors/cohort). (B) Growth curves of CT26 tumors in WT mice treated with the combination of EP2+EP6 or the IDO1 inhibitor epacadostat either without or with anti-PD1 antibody beginning 7 days after tumor engraftment. (left side) Responses to adjuvant alone, epacadostat, anti-PD1 or EP2+EP6 individually (gray lines), and combinations of epacadostat or EP2+EP6 with anti-PD1 (black lines) are plotted as means±SEM (n=10 tumors/cohort). P values for longitudinal tumor growth comparisons between the anti-PD1 and other treatment groups are included on each graph. P values from additional pairwise determinations are shown in online supplementary additional file 4. (right sides (all)) Individual growth curves for each treatment condition (X-axis is set at −100 on the Y-axis). In groups with complete responders (CRs), the number of animals represented is indicated on the graph.

