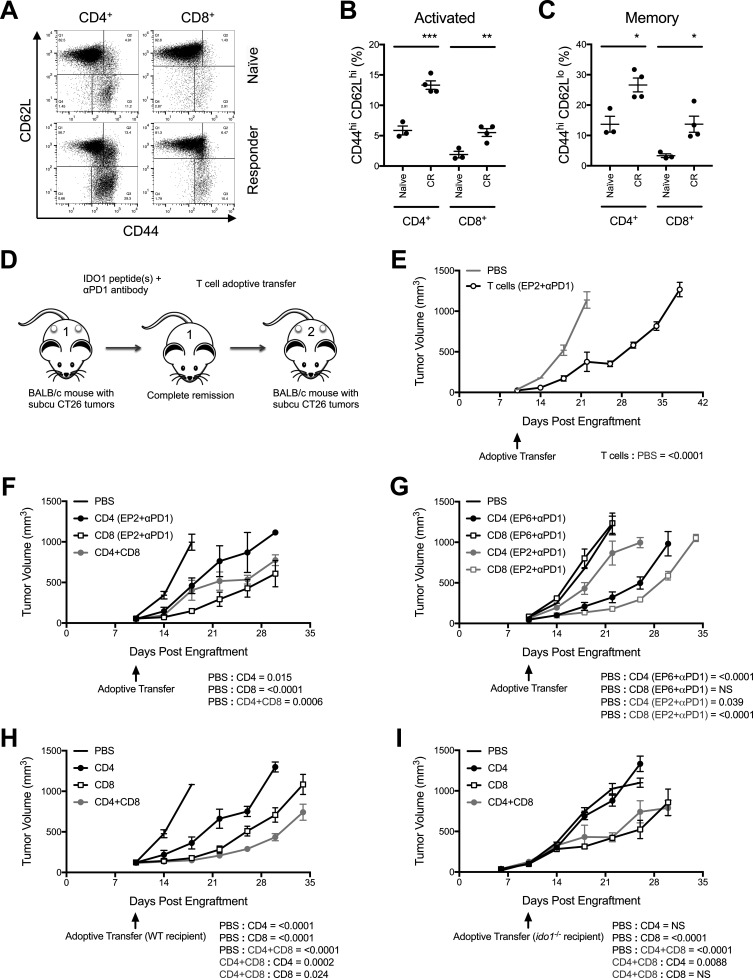
Figure 6.
Major histocompatibility complex (MHC) class I-directed and II-directed responses are predominantly mediated by CD8+ and CD4+ T cells, respectively. (A) Flow cytometry characterization of splenic T-cell populations from a complete responder (CR) mouse (bottom panels) compared with a naïve mouse (top panels). CD4+ CD8- (left panels) and CD8+ CD4- (right panels) gated populations assessed for levels of CD44 (X-axis) and CD62L (Y-axis). (B) Quantitative comparison of the proportional representation of CD44hi CD62Lhi (activated) populations of CD4+ and CD8+ T cells in the spleens of CR mice relative to naïve mice identified by flow cytometry analysis as shown in (E). Graphed as means±SEM with significance determined by two-tailed Student’s t-test (n≥3 mice/group). (C) Quantitative comparison of the proportional representation of CD44hi CD62Llo (memory) populations as described for B. (D) Schematic illustration of the basic strategy for adoptive transfer of T cells from IDO1 peptide(s)+programmed cell death protein 1-binding antibody (anti-PD1 antibody)-treated, CR mice to treatment naïve, tumor-bearing mice. (E) Growth curves of CT26 tumors in WT mice that received T cells isolated 10 days following tumor rechallenge from a CR mouse previously treated with anti-PD1 antibody and the MHC class I-directed IDO1 peptide EP2. Responses to PBS (gray line) and T cells (black line) are plotted as means±SEM (n=8 tumors/cohort). (F) Growth curves of CT26 tumors in WT mice that received flow cytometry sorted T-cell subsets isolated 10 days following tumor rechallenge from a CR mouse treated with anti-PD1 and EP2. Responses to PBS, CD4+, CD8+ (black lines), and combined CD4+ and CD8+ T cells (gray line) are plotted as means±SEM (n=4 tumors/cohort). (G) Growth curves of CT26 tumors in WT mice that received flow cytometry sorted T-cell subsets isolated 10 days following tumor rechallenge from CR mice treated with either anti-PD1 and the MHC class II-directed IDO1 peptide EP6 or anti-PD1 and EP2. Responses to PBS, CD4+ and CD8+ T cells from EP6+anti-PD1 (black lines) or EP2+anti-PD1 (gray lines) treated donors are plotted as means±SEM (n=6 tumors/cohort). (H) Growth curves of CT26 tumors in WT mice that received flow cytometry sorted T-cell subsets isolated 10 days following tumor rechallenge from a CR mouse treated with anti-PD1 and EP2+EP6. Responses to PBS, CD4+, CD8+ (black lines) and combined CD4+ and CD8+ T cells (gray line) are plotted as means±SEM (n=6 tumors/cohort). (I) As described above in G except the recipient mice were Ido1-/- (n=6 tumors/cohort). P values for longitudinal tumor growth comparisons between the PBS (no cells) and different T-cell adoptive transfer cohorts are included on graphs E–I. P values for comparisons between the combined and individual CD4+ and CD8+ adoptive transfer cohorts are also included for graphs H and I. *P<0.05;**p<0.01; ***p<0.001.

